Fig. 7.
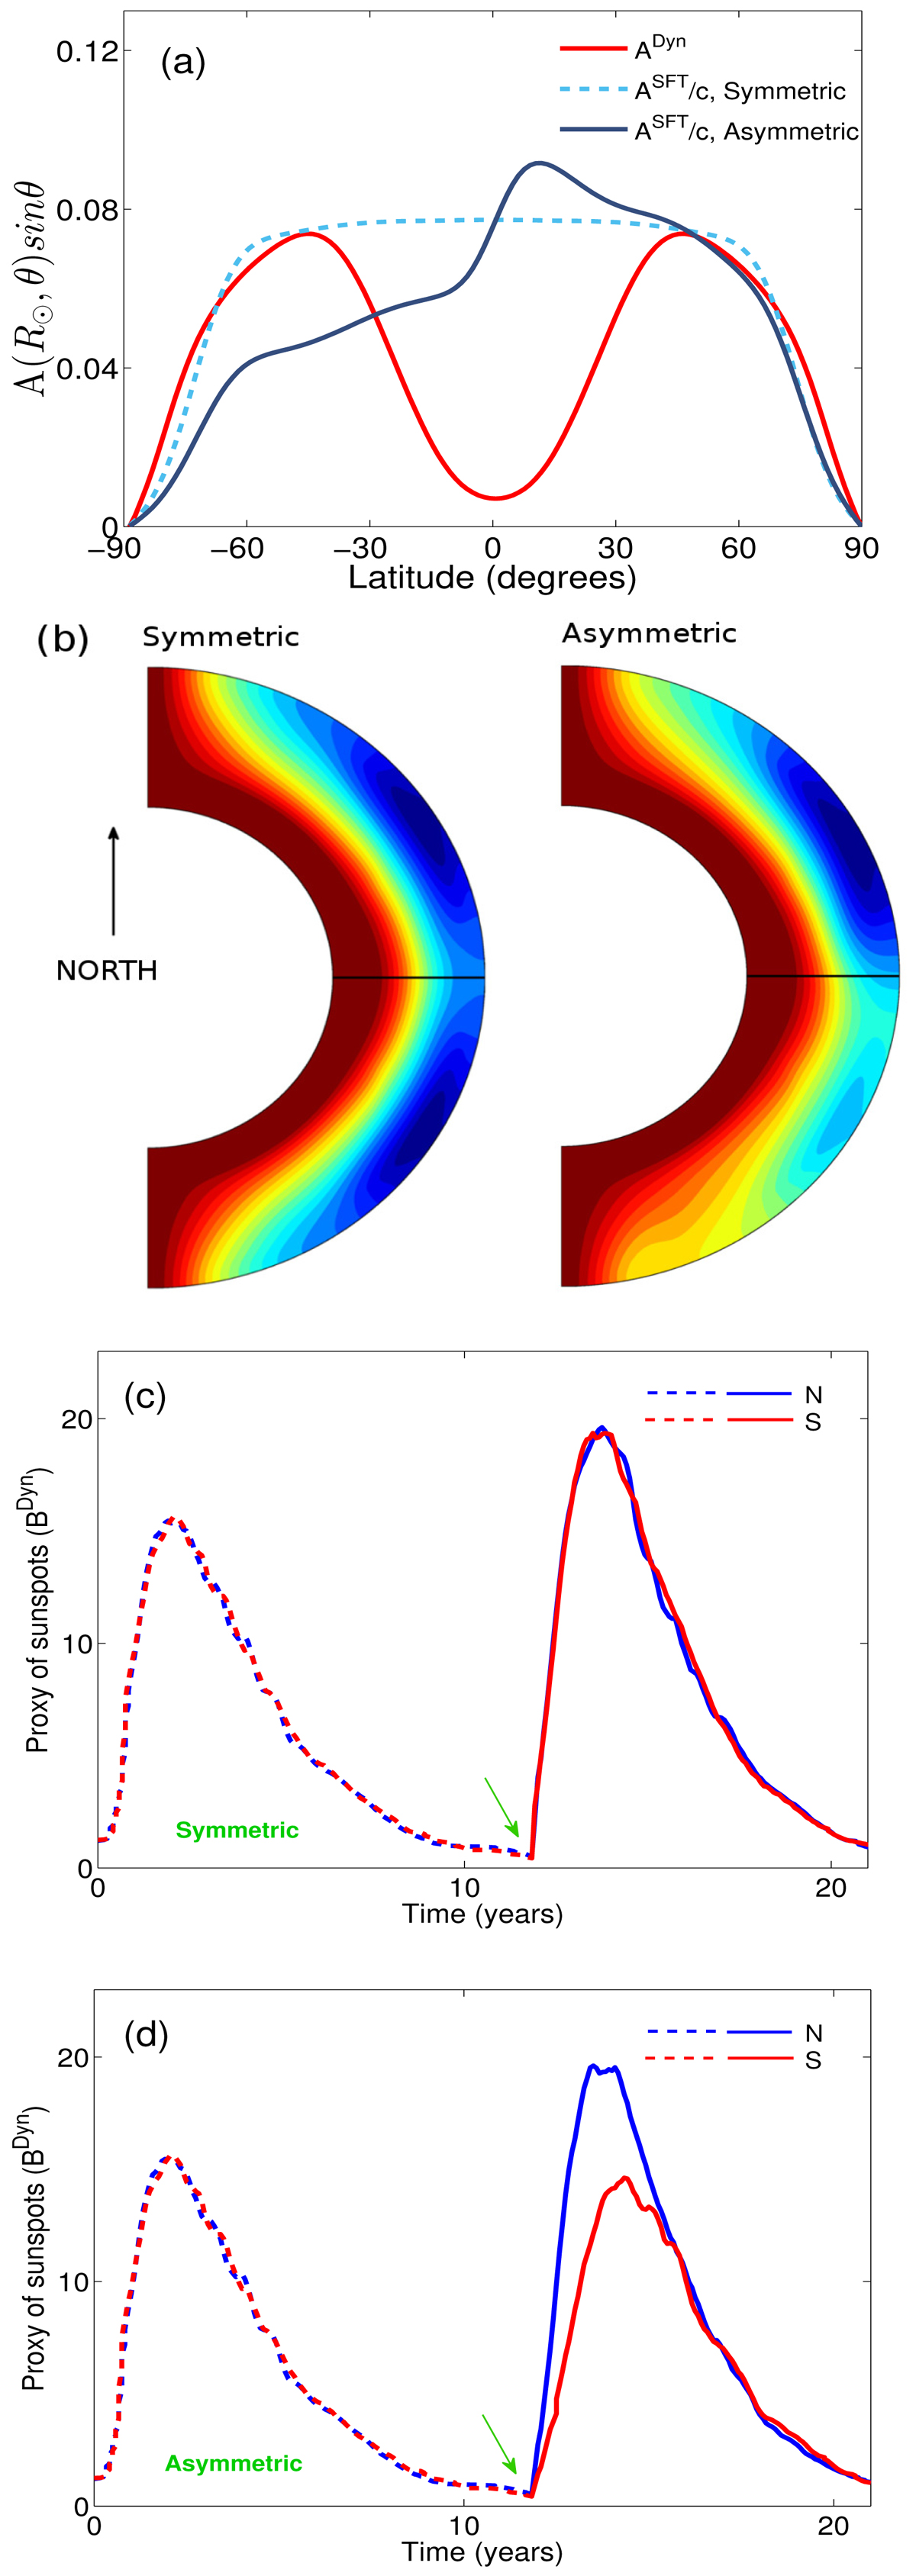
Panel a: vector potentials at cycle minimum on the solar surface as obtained from SFT and dynamo simulations. Panel b: two distribution of vector potentials associated with the symmetric and asymmetric cases on the meridional plane. Panels c and d: evolution of BDyn for the symmetric and asymmetric cases, while the green arrows indicate the timing when outputs obtained from the SFT simulations are assimilated in the dynamo model.
Current usage metrics show cumulative count of Article Views (full-text article views including HTML views, PDF and ePub downloads, according to the available data) and Abstracts Views on Vision4Press platform.
Data correspond to usage on the plateform after 2015. The current usage metrics is available 48-96 hours after online publication and is updated daily on week days.
Initial download of the metrics may take a while.