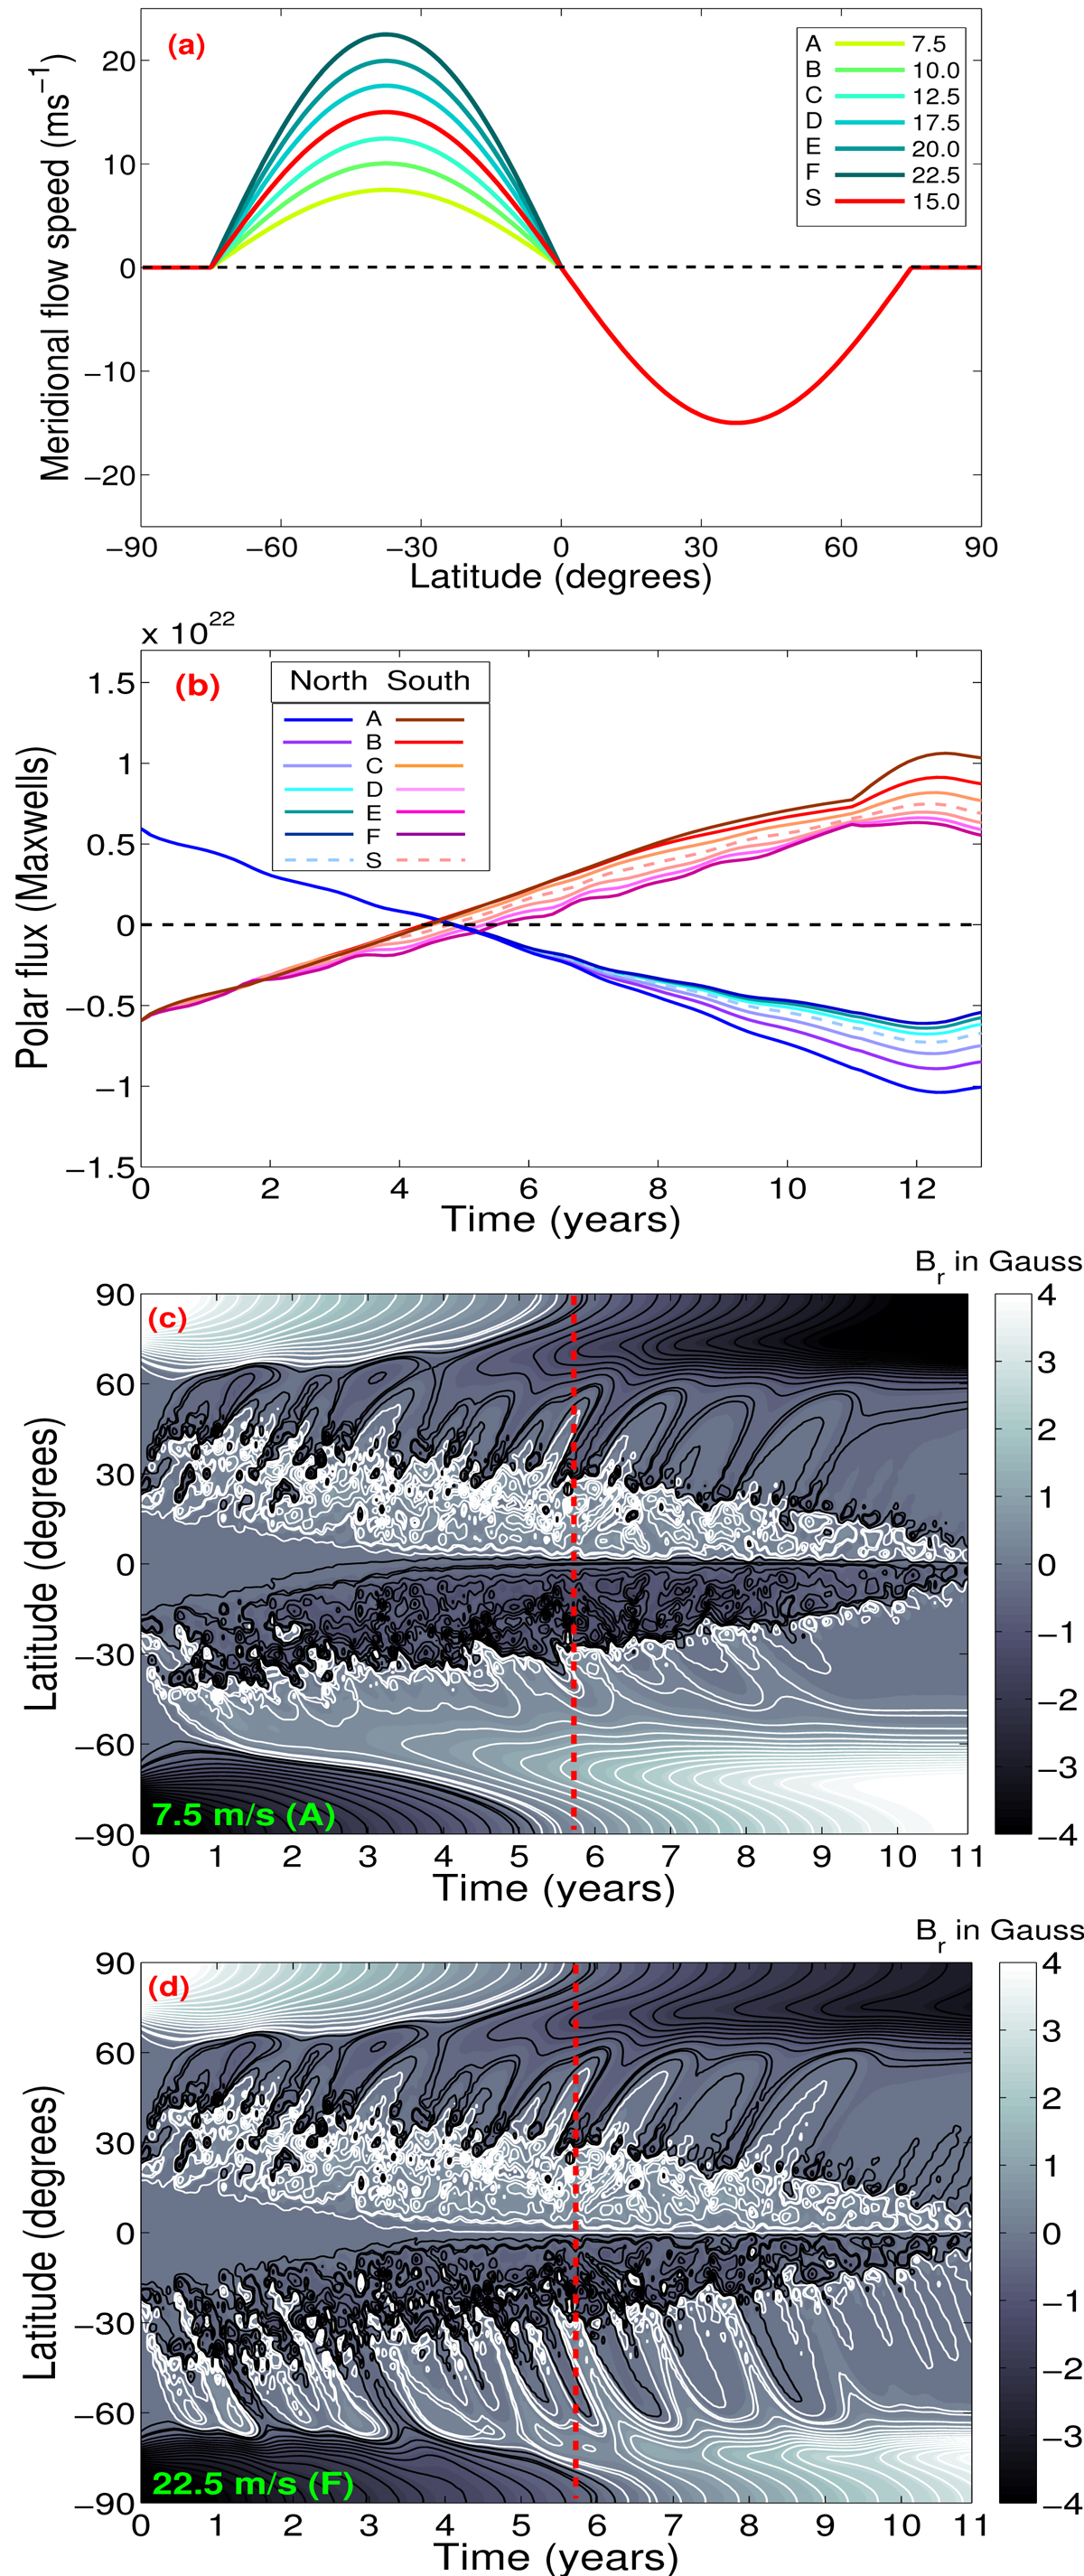
Fig. 6.

Panel a: meridional circulation profiles as functions of latitude where the peak speed varies from 7.5 ms−1 to 22.5 ms−1 (denoted by different colours) in southern hemisphere. Positive (and negative) velocities indicate the flow is towards the south (and north) pole. Each flow profile is labelled alphabetically starting from “A” to “F”, while “S” represents the symmetric profile. Panel b: time evolution of the corresponding hemispheric polar flux. Panels c and d: magnetic butterfly diagram corresponding to the case A (with peak flow speed 7.5 ms−1) and the case F (peak speed 22.5 ms−1). The red dashed vertical lines depict the time of sunspot maximum.
Current usage metrics show cumulative count of Article Views (full-text article views including HTML views, PDF and ePub downloads, according to the available data) and Abstracts Views on Vision4Press platform.
Data correspond to usage on the plateform after 2015. The current usage metrics is available 48-96 hours after online publication and is updated daily on week days.
Initial download of the metrics may take a while.


