Free Access
Fig. 5.
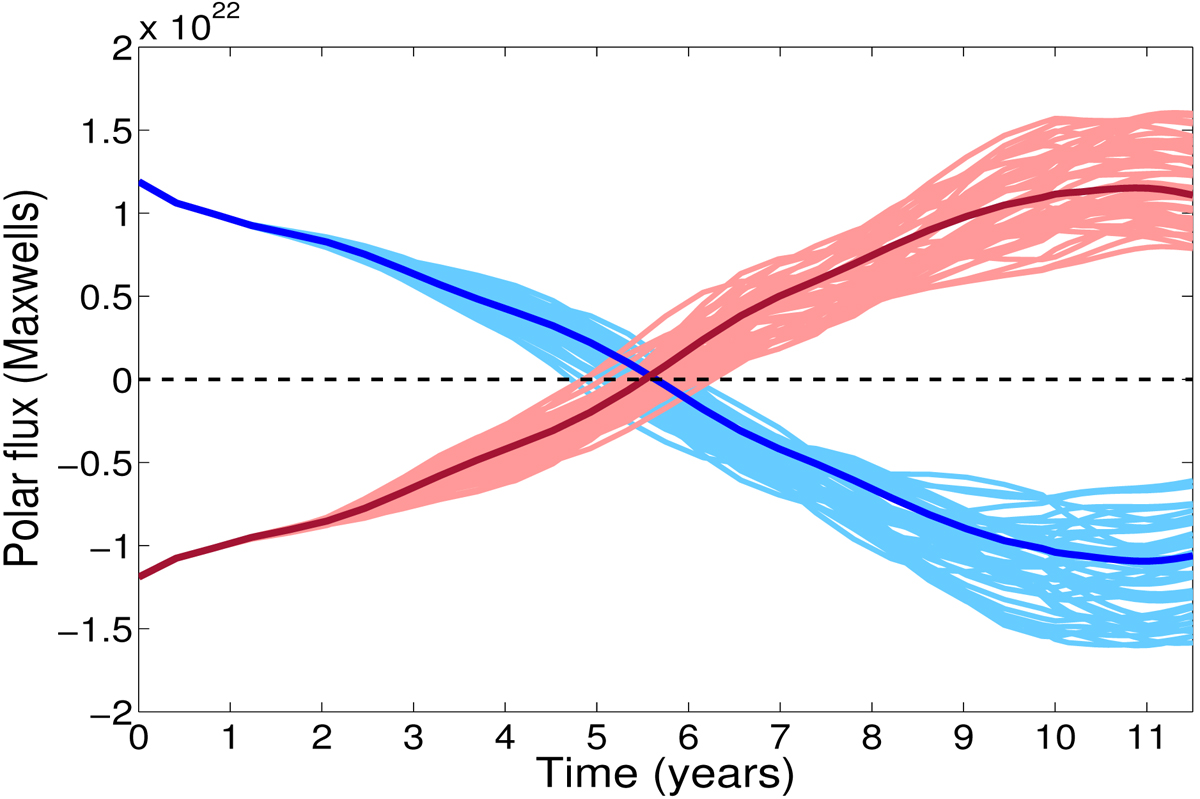
Time evolution of polar flux in the northern and southern hemispheres associated with 50 individual input profiles depicted by set of light blue and light red curves, respectively. The dark blue and dark red curves represent the same corresponding to the standard symmetric profile.
Current usage metrics show cumulative count of Article Views (full-text article views including HTML views, PDF and ePub downloads, according to the available data) and Abstracts Views on Vision4Press platform.
Data correspond to usage on the plateform after 2015. The current usage metrics is available 48-96 hours after online publication and is updated daily on week days.
Initial download of the metrics may take a while.