Fig. 4.
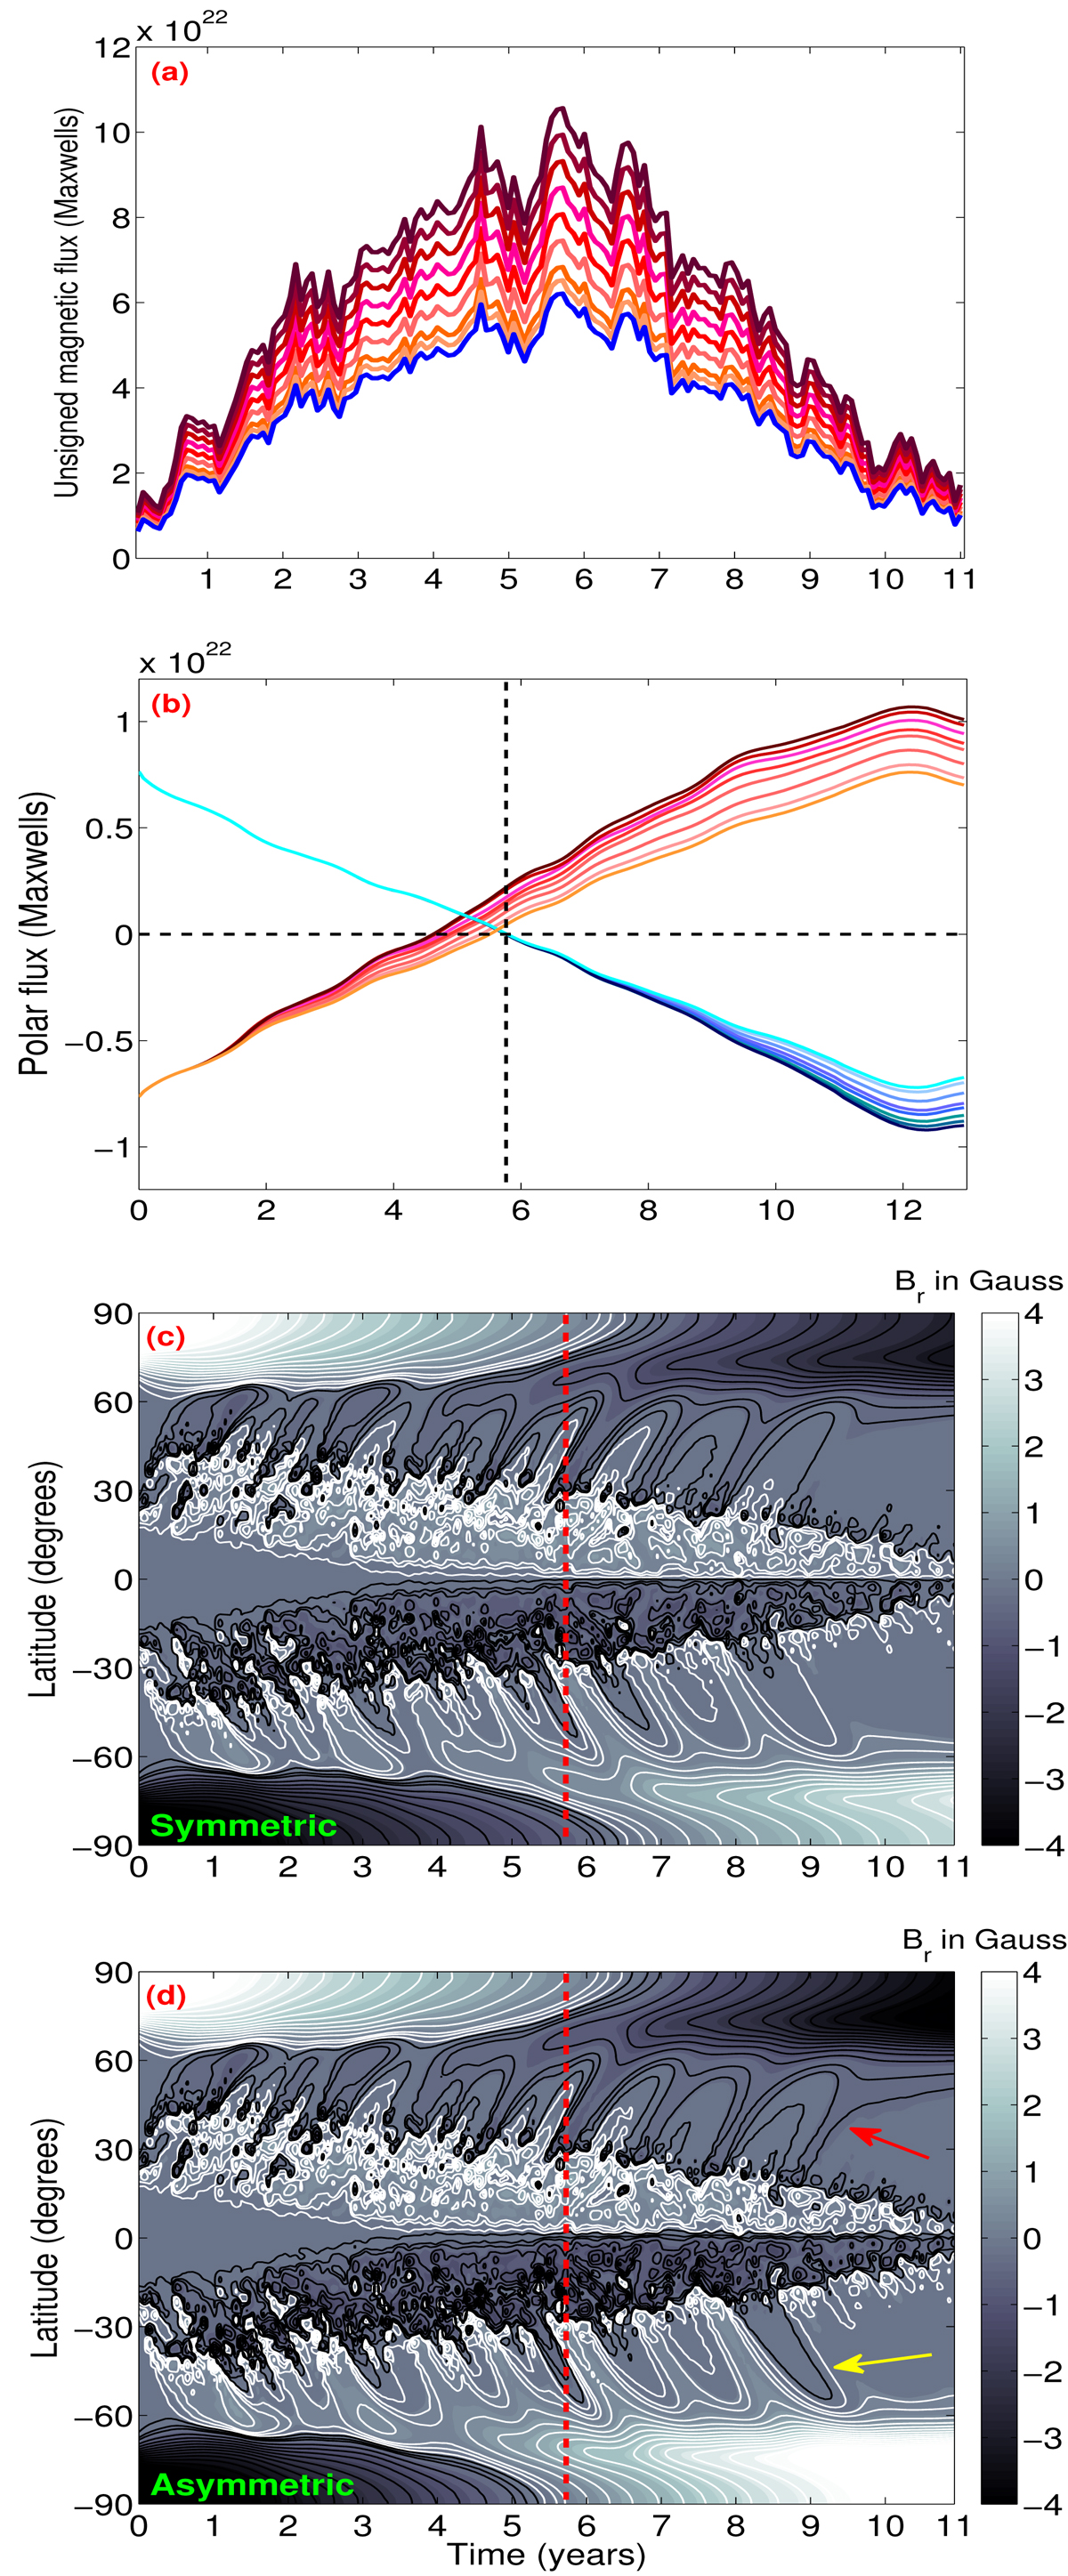
Panel a: time evolution of unsigned magnetic flux in the northern by a blue curve and in the southern hemispheres by red curves with different shades corresponding to increasing strength (5%–70% compared to the northern hemisphere). Panel b: corresponding polar flux evolution in two hemispheres. The time evolution of the longitudinally averaged magnetic field (radial component) as a function of latitude is depicted for two cases; in panel c the input sunspot profile is identical in two hemispheres and in panel d the southern hemispheric sunspot flux is 70% higher compared to that in the northern hemisphere. The red and yellow arrows indicate two prominent distinct patterns in the time latitude distribution of the magnetic field present corresponding to the hemispheric asymmetric case. The red (and the black in (b)) dashed vertical lines refer to the timing of sunspot cycle maximum.
Current usage metrics show cumulative count of Article Views (full-text article views including HTML views, PDF and ePub downloads, according to the available data) and Abstracts Views on Vision4Press platform.
Data correspond to usage on the plateform after 2015. The current usage metrics is available 48-96 hours after online publication and is updated daily on week days.
Initial download of the metrics may take a while.