Fig. 2.
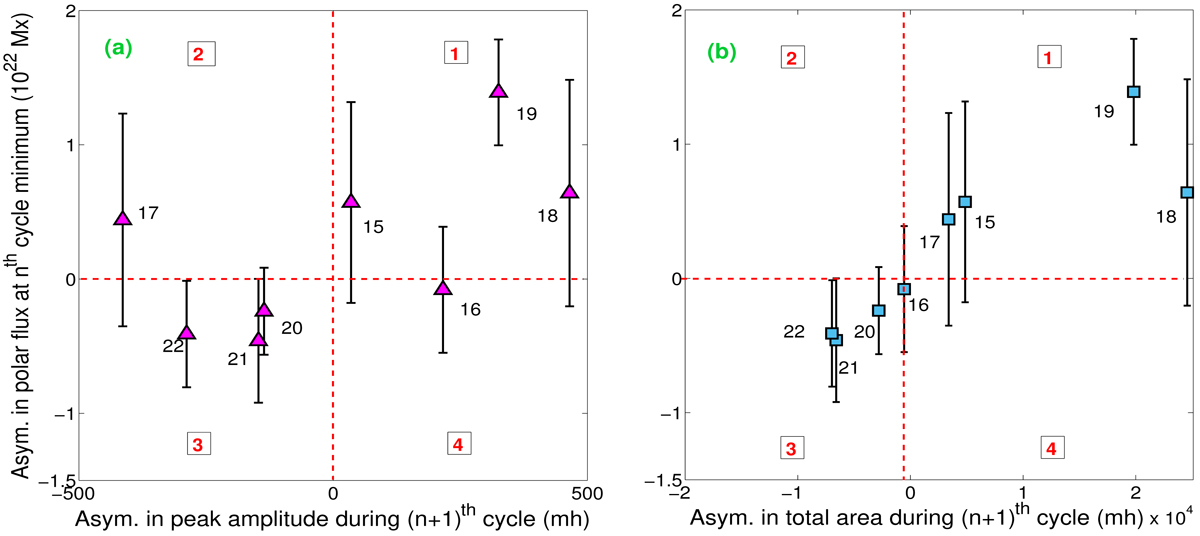
Panel a: hemispheric asymmetry in polar flux (maxwells) during minimum of the nth cycle (“n” varying from 15 to 22) vs. the asymmetry in sunspot area (in micro-hemispheres) during the following cycle maximum. Panel b: asymmetry in polar flux is compared with the asymmetry in total sunspot area of the following cycle. The numbers 1–4 represent the first, second, third, and fourth quadrants, respectively. The uncertainties present in polar flux observation are also depicted by error bars in both panels. The Spearman’s rank correlation coefficient between the absolute amplitude of the asymmetry associated with the polar flux and total hemispheric sunspot area is 0.73 with p-value 0.04.
Current usage metrics show cumulative count of Article Views (full-text article views including HTML views, PDF and ePub downloads, according to the available data) and Abstracts Views on Vision4Press platform.
Data correspond to usage on the plateform after 2015. The current usage metrics is available 48-96 hours after online publication and is updated daily on week days.
Initial download of the metrics may take a while.