| Issue |
A&A
Volume 631, November 2019
|
|
|---|---|---|
| Article Number | L2 | |
| Number of page(s) | 8 | |
| Section | Letters to the Editor | |
| DOI | https://doi.org/10.1051/0004-6361/201936488 | |
| Published online | 11 October 2019 | |
Letter to the Editor
Constraining disk evolution prescriptions of planet population synthesis models with observed disk masses and accretion rates
1
European Southern Observatory, Karl-Schwarzschild-Strasse 2, 85748 Garching bei München, Germany
e-mail: This email address is being protected from spambots. You need JavaScript enabled to view it.
2
Physikalisches Institut, University of Bern, Gesellschaftsstrasse 6, 3012 Bern, Switzerland
3
INAF – Osservatorio Astrofisico di Arcetri, L.go E. Fermi 5, 50125 Firenze, Italy
4
Institute for Astronomy, University of Hawai’i at Mänoa, Honolulu, HI, USA
5
Dipartimento di Fisica, Università Degli Studi di Milano, Via Celoria 16, 20133 Milano, Italy
6
Lunar and Planetary Laboratory, University of Arizona, 1629 E. University Blvd., Tucson, AZ 85721, USA
Received:
9
August
2019
Accepted:
20
September
2019
Abstract
While planets are commonly discovered around main-sequence stars, the processes leading to their formation are still far from being understood. Current planet population synthesis models, which aim to describe the planet formation process from the protoplanetary disk phase to the time exoplanets are observed, rely on prescriptions for the underlying properties of protoplanetary disks where planets form and evolve. The recent development in measuring disk masses and disk-star interaction properties, i.e., mass accretion rates, in large samples of young stellar objects demand a more careful comparison between the models and the data. We performed an initial critical assessment of the assumptions made by planet synthesis population models by looking at the relation between mass accretion rates and disk masses in the models and in the currently available data. We find that the currently used disk models predict mass accretion rate in line with what is measured, but with a much lower spread of values than observed. This difference is mainly because the models have a smaller spread of viscous timescales than what is needed to reproduce the observations. We also find an overabundance of weakly accreting disks in the models where giant planets have formed with respect to observations of typical disks. We suggest that either fewer giant planets have formed in reality or that the prescription for planet accretion predicts accretion on the planets that is too high. Finally, the comparison of the properties of transition disks with large cavities confirms that in many of these objects the observed accretion rates are higher than those predicted by the models. On the other hand, PDS70, a transition disk with two detected giant planets in the cavity, shows mass accretion rates well in line with model predictions.
Key words: planets and satellites: formation / protoplanetary disks / surveys / accretion / accretion disks
ESO fellow.
© ESO 2019
1. Introduction
While it is now well accepted that exoplanetary systems are ubiquitous, we are still debating how to explain their formation and their diversity. In particular, one of the major shortcomings in this quest is to describe correctly the properties of protoplanetary disks, the site where planets form, in the current models of planet formation (e.g., Morbidelli & Raymond 2016, for a review).
In the last decade, a big effort has been put into population synthesis models to describe what kind of exoplanetary systems are produced given some assumptions on the disk morphology and evolution, on the formation of planets, and on the accretion of material on planetesimals (e.g., Benz et al. 2014, for a review). Both the properties of disks at the time of the formation of planets and the exact process governing the growth of dust from small grains to pebbles, and from planetesimals to planetary cores, are still flawed by several unknowns.
In this work we attempt an initial comparison between the assumed disk structure in current planet population synthesis models (Mordasini et al. 2012) with available observations of some of the key disk parameters, in particular the disk mass (Mdisk) and mass accretion rate onto the star (Ṁacc). Such a comparison is the first step to validate the assumptions made by the models, on the one hand, and to identify where current models must be revised, on the other hand.
2. Observational data
To date, the complete disk-bearing population of young stars in two star-forming regions with age ∼1–3 Myr, Lupus and Chamaeleon I, have been observed both with optical spectroscopy with the Very Large Telecope (VLT) X-shooter instrument and with the Atacama Large Millimeter and submillimeter Array (ALMA). These instruments currently represent the best means to measure Ṁacc and Mdisk. Indeed, combining the X-shooter data analyzed by Alcalá et al. (2014, 2017) and the ALMA data by Ansdell et al. (2016) for the targets in the Lupus complex, Manara et al. (2016a) showed that there is a correlation between Ṁacc and Mdisk, when the latter is obtained by converting the continuum flux into dust mass. Similarly, Mulders et al. (2017) confirmed the Ṁacc − Mdisk correlation by combining the X-shooter data analyzed by Manara et al. (2016b, 2017) with the ALMA data analyzed by Pascucci et al. (2016).
In the following, these two data sets are used as a prime comparison set for the planet population synthesis model disk parameters. We assume that the total disk mass, Mdisk, is equal to 100 times the disk dust mass, which is measured by converting the observed continuum flux assuming the opacity κν = 2.3 cm2 g−1 ⋅ (ν/230 GHz)0.4 (Andrews et al. 2013)1 and a disk temperature of 20 K (Ansdell et al. 2016; Pascucci et al. 2016; Pinilla et al. 2018). As in Manara et al. (2018), Mdisk is rescaled to the Gaia data release 2 (DR2; Gaia Collaboration 2016, 2018) distances for the individual stars, and Ṁacc is also recalculated after rescaling the accretion luminosity and stellar luminosity to the Gaia DR2 distances (see Tables A.1 and A.2).
We performed a fit of the combined sample of data in Chamaeleon I and Lupus using these revised values. Following Manara et al. (2016a) and Mulders et al. (2017), the fit is performed using LINMIX2 (Kelly 2007) on the objects with detected disks and measured Ṁacc. The best fit relation is log Ṁacc = (0.9 ± 0.1) · log Mdisk − (6.5 ± 0.4) with a correlation coefficient r = 0.6 and a dispersion of 0.9 dex that is slightly more dispersed and steeper than previously reported, but still within uncertainties.
To increase the sample of disks with dust cavities resolved by ALMA, the so-called transition disks, we used the compilation by Pinilla et al. (2018) and included PDS70 (Keppler et al. 2019; Haffert et al. 2019). The list of objects considered in this work are reported in Table A.3, where Ṁacc and Mdisk are also rescaled to the Gaia DR2 distances.
3. Comparison with models for planet formation synthesis
As described by Mordasini et al. (2009, 2012), the Bern planet population synthesis models are based on the core accretion paradigm for planet formation, coupled to a model of disk evolution and tidal migration of the planets (Alibert et al. 2005). In particular, the disk evolution model (described in Benz et al. 2014) relies on solving the viscous evolution equation (Lynden-Bell & Pringle 1974), parameterized by an α-parameter of 2 × 10⁻³, coupled with a prescription for external far-ultraviolet photo-evaporation (Matsuyama et al. 2003) with a mass loss rate randomly sampled to disperse the disk according to a typical disk lifetime (Haisch et al. 2001), and internal extreme-ultraviolet radiation (Clarke et al. 2001), which is responsible for opening a gap in the disk when Ṁacc ≲ 10−11 M⊙ yr−1, plus mass removal because of accretion by growing planets. In the models the initial disk mass distribution is taken from Tychoniec et al. (2018) and has a mean value 30 MJup and a dispersion of ∼0.2 dex. The initial radii distribution is set using the relation between disk mass and disk characteristic radius (Rc) described by Andrews et al. (2010), assuming this is valid for the initial disk masses. We note, however, that this relation is based on many disks showing substructures, which are known to be the largest (Long et al. 2019), and on evolved disks, whose sizes could not reflect the initial size distribution, but could be the effect of radial drift in the disk (e.g., Rosotti et al. 2019). The models discussed in this work assume central stars with a mass of 1 M⊙. This assumption is only relevant for the following discussion as a second order correction. Indeed, it is known that the disk mass depends on the stellar mass (e.g., Ansdell et al. 2016; Pascucci et al. 2016), but the disk masses covered by models reproduce the full range of observed disk masses for disks around a large range of stellar mass. The information on the mass of the central star enters only indirectly in the values of the viscosity (ν) used in the models. Indeed, this parameter is expressed as ν = αcsH, where cs is the sound speed and H the scale height of the disk; the latter two parameters are obtained by solving for the vertical structure equilibrium due to viscous heating and stellar irradiation as described by Chiang & Goldreich (1997). Similarly, a dependence of the mass loss rate from photo-evaporation with stellar mass is expected (e.g., Owen et al. 2011), but as a second order effect.
In the following, we use the snapshot of the models at t = 2 Myr for a comparison with the data. The models we considered start with 100 seeds of planetary systems, which is the most consistent value with planet detections with Kepler and HARPS (Mulders et al. 2019). The age at which the models are evaluated is chosen to be in line with typical estimates for the ages of the Chamaeleon I and Lupus regions, which are considered to be ∼1−3 Myr old. At this age, ≲10% of the modeled disks have masses below the numerical minimum density, i.e., they have dissipated.
The distribution of Ṁacc and Mdisk for the models (Fig. 1) presents three main loci. First (A), ∼65% of the model points are located along a major Ṁacc − Mdisk sequence, almost parallel to lines of constant Mdisk/Ṁacc, and between the lines of Ṁacc − Mdisk = 1 Myr and 10 Myr. Second (B), ∼5% of the points are found at Mdisk ≲ 10−4 M⊙ and Ṁacc ≲ 10−11 M⊙ yr−1, to the bottom left of the plot. Third (C), ∼20% of the points are located at 10−3 M⊙ ≲ Mdisk ≲ 10−1 M⊙ and at Ṁacc lower than the typical values found in models in the same Mdisk range. These three main loci are easily understood as: (A) the main location where disks in the models spend their lifetime; (B) the locus of the disks in which internal photo-evaporation has overcome the effect of viscous evolution, has stopped accretion, and is rapidly dissipating the disks; and (C) the locus where giant planet formation has taken place, respectively. We note that the photo-evaporation prescription used in the models is directly responsible for the number of objects present in locus (B) and for the values of Mdisk and Ṁacc, where the separation between loci (A) and (B) is visible. A more vigorous mass loss rate, such as that produced by X-ray photo-evaporation (e.g., Picogna et al. 2019), would change the shape of the locus (B) and would accelerate the disk dispersal. Thus, a more vigorous mass loss rate would increase the fraction of models in locus (B). In the disk models in locus (C), a large percentage of the disk accretion flow ends up on the accreting planets instead of the star. Indeed, the models in which at least one giant planet – defined as having Mplanet > 1 MJup – are highlighted in Fig. 2 and are located in locus (C), represent ∼75% of the models in this locus. As expected, we find the accreting giant planets in massive disk with low or no accretion (e.g., Williams & Cieza 2011; Rosotti et al. 2017).
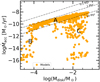 |
Fig. 1. Mass accretion rate vs. disk mass predicted by 2 Myr old disk models used in planetary synthesis population models (orange filled circles). A, B, and C show the three main loci described in the text. |
The comparison between the data and the models of Fig. 2 shows that the model parameters have some similarities to the observations. In particular, the main locus (A) of the Ṁacc − Mdisk values of the models is in line with the data. Most notably, in the disk mass range from 10−4 − 10−2 M⊙ the upper bound of the locus of the models follows very well the best fit of the observations, whereas at Mdisk ≳ 10−2 M⊙ the models in the main group (A) tend to bend to slightly lower Ṁacc. Moreover, the typical values of Ṁacc are within the observed values for the Chamaeleon I and Lupus regions.
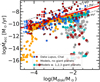 |
Fig. 2. Mass accretion rate vs. disk mass for the models (filled circles) and for the observed population of disks in the Lupus (blue symbols) and Chamaeleon I (red symbols) regions. Squares are used for disks with measured disk mass and mass accretion rates; squares with arrow report upper limits on the disk mass; downward facing triangles report dubious accretors, i.e., objects with mass accretion rates compatible with chromospheric emission; and the transition disks are highlighted with a circle around the symbol. The red line indicates the best fit. The models are colored for the number of giant planets (Mplanet > 300 M⊕) in the system: orange for no giant planets, cyan for one giant planet, gray for two giant planets, and brown for three giant planets. |
However, a number of significant differences are present. The dispersion of Ṁacc at any Mdisk of the main locus of the models (∼0.3 dex) is much smaller than that of the data (∼0.9 dex). This is partially because the models shown in this work are not convolved with the typical observational uncertainties (≲0.4 dex). However, the discrepancy is larger than this effect. This discrepancy is in line with the results of Lodato et al. (2017) and Mulders et al. (2017), who postulated a large spread of model parameters, in particular of the viscous timescale and/or α, and a long viscous timescale on the order of ∼1 Myr to reproduce the observed spread. More specifically, Mulders et al. (2017) require that the values of α are distributed around a typical value of 10−3 with a dispersion of 2 dex to reproduce the observations in contrast to the single value assumed in the models. The single value of α however still connects to a dispersion in viscous timescales (tν) since the initial disk radii present a distribution of values. Indeed,  , thus we can assume a value of γ = 1.5, H/R = 0.1, and α = 2 × 10⁻³ to derive the viscous timescales of the models. This distribution has a spread of ≲0.5 dex, smaller than the spread of ∼1 dex needed by Lodato et al. (2017) to reproduce the observed Mdisk − Ṁacc. The values of Ṁacc for the main locus of the models are then within the typical observed values, but are systematically below the median of the distribution, i.e., the best fit. This fact is related to the assumed value of α and to the other disk initial parameters. A higher value of α increases the predicted Ṁacc, but implies a shorter timescale of the disks.
Finally, almost no overlap is present between the observed data and the model points in the (B) photo-evaporative and (C) giant planet forming disk regions. On the one hand, the fact that we do not observe the photo-evaporative disks is easily explainable. These disks are predicted to have low mass, at Mdisk values where ALMA surveys are incomplete and dominated by upper limits (e.g., Ansdell et al. 2016; Pascucci et al. 2016), and the lifetime of these disks is expected to be very short, i.e., ∼105 yr (e.g., Ercolano & Pascucci 2017). Furthermore, the values of Ṁacc reported by the models for these disks are well below the lowest values detectable from spectra of accreting young stars (e.g., Manara et al. 2013). These predicted disks could be Class III, i.e., diskless, young stellar objects.
On the other hand, it is worth asking whether the number of models in the giant planet forming disk locus is in line with observations. At the values of Mdisk corresponding to these models the ALMA surveys are complete, since any disk that shows an infrared excess with Spitzer has been targeted and the sensitivity of the surveys is always such that these massive disks are readily detected. Even in the case in which the disk surveys were not complete, there should be no bias against massive disks with already formed giant planets. Similarly, the spectroscopic surveys connected to the ALMA surveys are ∼95% complete, and they are usually slightly incomplete in the lower stellar mass end of the distribution of targets, which corresponds to the lower disk masses. Therefore, it is safe to assume that both the massive disks and the corresponding stars have been observed in the ALMA and X-shooter surveys. It is in any case possible that the observed targets have values of Ṁacc lower than what is detectable with X-shooter spectra. As discussed by Manara et al. (2013) and Ingleby et al. (2011), among others, Ṁacc compatible with or lower than the typical chromospheric noise of young stellar objects are not measurable from near-ultraviolet and optical spectra. This limit depends on the stellar mass and is typically ∼10−11 − 10−10 M⊙ yr−1, exactly in the region where the giant planet forming disks with higher Ṁacc are located. Both Alcalá et al. (2014, 2017) and Manara et al. (2016b, 2017) have reported a number of objects present in the surveys of Lupus and Chamaeleon I for which the excess emission in the spectra has a strength that is compatible with being chromospheric. These objects, highlighted with downward triangles in the plots and referred to as “weak-accretors”, are the only candidates to have real Ṁacc lower than this chromospheric noise. However, these weak-accretors account for only ∼6−12% of the observed population of objects with a disk in these two regions, and have in some cases Mdisk lower than the lowest masses of giant planet forming disks in the models. Even in the case that these are all objects whose Ṁacc is in line with that reported for giant planet forming disks, the fraction of disks with these low Ṁacc is smaller by at least a factor of two than predicted by current planet synthesis population models. This is well in line with the overabundance of planets formed in models in comparison with current detections of planets with Kepler and HARPS (Mulders et al. 2019).
4. Transition disks and disks with planets
To better understand the population of giant planets forming disks predicted by the models we compiled a list of known transition disks with dust cavities resolved by ALMA observations, i.e., larger than ∼20–30 au (Pinilla et al. 2018, see Table A.3). One of the favored explanations for the cavities observed with ALMA is indeed the presence of one, or more, giant planets in the inner regions of these disks. In one case, PDS 70, two accreting giant planets have been detected in the dust depleted cavity (Keppler et al. 2018; Haffert et al. 2019). The disk masses and Ṁacc for these targets are shown in Fig. 3 together with the transition disks located in the Lupus and Chamaeleon I regions and the models. All the transition disks with Mdisk > 10−3 M⊙ have been resolved with ALMA. When the central star is not a Herbig star, their Ṁacc are within the range of the models given their Mdisk in ∼80% of the cases and are always compatible within the uncertainties. However, ∼10–20% of the targets are only compatible with models of disks with not yet formed giant planets. In a way, this is similar to what was discussed by Ercolano & Pascucci (2017, and references therein), meaning that there are too many transition disks with high accretion rates than predicted by photo-evaporation models. Allowing a more rapid dispersal of the disk due to planet-induced photo-evaporation (Rosotti et al. 2013) might mitigate the discrepancy here by allowing a faster disk dispersal in the low-Ṁacc and high-Mdisk objects that formed a planet predicted by the models discussed here. A similar effect would also be obtained including stronger photo-evaporative winds, as in the case of X-ray photo-evaporation, although even these models still are unable to reproduce the observed accreting transition disks with large cavities (Picogna et al. 2019).
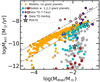 |
Fig. 3. Mass accretion rate vs. disk mass for the models (filled circles, colors as in Fig. 2) and for transition disks with resolved cavities. The pink symbols show transition disks around T Tauri stars and the violet symbols the transition disks around Herbig stars from Pinilla et al. (2018). The gray star symbol refers to PDS 70. Other symbols as in Fig. 2. |
It is worth noting that five transition disks around T Tauri stars (∼25%) present Ṁacc values compatible with those of models in which at least two giant planets have formed, either measured Ṁacc values or because they are weak-accretors. In particular, PDS 70 falls well within the region where models predict two giant planets to have formed, and J1604–2165, another well-studied transition disk, is also in the same region of the parameter space. Furthermore, two of the five Herbig stars with transition disks reported in this work only have an upper limit on the value of Ṁacc, and they can potentially be compatible with having Ṁacc in line with disks with giant planets.
5. Conclusions
We performed the first comparison between observed properties of disks, namely their mass and mass accretion rate on the central star, with disk properties predicted by models adopted for planetary synthesis population studies for ∼1–3 Myr old protoplanetary disks.
We showed that the planetary synthesis population models typically predict disks with lower Ṁacc than the median measured values, but still within the observed spread. However, the spread of Ṁacc predicted by these disk models is too small to match the observed spread, since the spread in the viscous timescale is too small. This is in line with what was suggested by Lodato et al. (2017) and Mulders et al. (2017). Therefore, planetary synthesis population models must use a larger dispersion of viscous timescales to match the observations.
The planetary synthesis models discussed in this work predict a larger percentage, of ∼20%, of disks with very low Ṁacc ≲ 10−10 M⊙ yr−1 and high Mdisk ≳ 3 × 10⁻³ M⊙ than what is observed in ∼1–3 Myr old disk populations, i.e., ∼6–12%. This discrepancy points to either the fact that fewer giant planets are forming in disks than what is predicted by models, as pointed out also by Mulders et al. (2019), or to the fact that the current prescription of gas accretion onto planets overpredicts the real accretion rate onto planets. The latter would make the accretion rate onto the star lower than observed. This might be related to the models that underpredict the number of intermediate mass planets when compared to the planetary mass function deduced from microlensing surveys (Suzuki et al. 2018).
The comparison between the models and the measured values of Ṁacc and Mdisk for transition disks with large cavities, which are possibly explained by the presence of giant planets, shows some agreement with this hypothesis that the cavities are carved by giant planets. Indeed, the majority (∼80%) of transition disks have values of Ṁacc and Mdisk that are compatible with what is expected for disks with at least one giant planets formed. Most notably, the system PDS 70 has measured Mdisk and Ṁacc well in line with predictions for systems with two giant planets, which have been observed in this system. However, there is a small percentage, ∼20%, of transition disks with Ṁacc that is higher than the highest Ṁacc predicted by the models. Different initial conditions for viscously evolving disks are needed, or different models of disk evolution should be explored, such as magnetic disk wind driven evolution, to explain these objects.
Future work should focus on detailed comparisons between the models and the current and future observations. In particular, it is important to test whether the disks with Mdisk ≲ 10−4 M⊙ and Ṁacc ≲ 10−12 M⊙ yr−1, predicted by the currently adopted prescriptions for photo-evaporation and by planet synthesis population models, can be observed. To this aim, higher sensitivity and resolution ALMA surveys are needed. Related to this point, a more detailed description of the effect of internal photo-evaporation, for example including X-ray photo-evaporation (e.g., Picogna et al. 2019), should be explored in the planet synthesis population models to understand how the picture of disk properties and planet formation would be affected. Finally, this work did not discuss how these properties vary with the assumed stellar masses and at later times. This must be the subject of future studies.
Only the values of Mdisk from Ansdell et al. (2016) have to be rescaled to this different opacity.
Acknowledgments
We are grateful to the referee for a constructive report that helped us to improve the manuscript. We thank Paola Pinilla for sharing information on the transition disk masses and for insightful comments. C.F.M. acknowledges support through the ESO fellowship. C.M. acknowledges the support from the Swiss National Science Foundation under grant BSSGI0_155816 “PlanetsInTime”. This project has received funding from the European Union’s Horizon 2020 research and innovation programme under the Marie Sklodowska-Curie grant agreement No. 823823 (DUSTBUSTERS). This work was partly supported by the Deutsche Forschungs-Gemeinschaft (DFG, German Research Foundation) – Ref no. FOR 2634/1 TE 1024/1-1. This work made use of the Python packages Numpy and matplotlib. This work has made use of data from the European Space Agency (ESA) mission Gaia (https://www.cosmos.esa.int/gaia), processed by the Gaia Data Processing and Analysis Consortium (DPAC, https://www.cosmos.esa.int/web/gaia/dpac/consortium). Funding for the DPAC has been provided by national institutions, in particular the institutions participating in the Gaia Multilateral Agreement.
References
- Alcalá, J. M., Natta, A., Manara, C. F., et al. 2014, A&A, 561, A2 [NASA ADS] [CrossRef] [EDP Sciences] [Google Scholar]
- Alcalá, J. M., Manara, C. F., Natta, A., et al. 2017, A&A, 600, A20 [NASA ADS] [CrossRef] [EDP Sciences] [Google Scholar]
- Alibert, Y., Mordasini, C., Benz, W., et al. 2005, A&A, 434, 343 [NASA ADS] [CrossRef] [EDP Sciences] [Google Scholar]
- Andrews, S. M., Wilner, D. J., Hughes, A. M., et al. 2010, ApJ, 723, 1241 [NASA ADS] [CrossRef] [Google Scholar]
- Andrews, S. M., Rosenfeld, K. A., Kraus, A. L., et al. 2013, ApJ, 771, 129 [NASA ADS] [CrossRef] [Google Scholar]
- Ansdell, M., Williams, J. P., van der Marel, N., et al. 2016, ApJ, 828, 46 [Google Scholar]
- Benz, W., Ida, S., Alibert, Y., et al. 2014, Protostars and Planets VI, 691 [Google Scholar]
- Chiang, E. I., & Goldreich, P. 1997, ApJ, 490, 368 [NASA ADS] [CrossRef] [Google Scholar]
- Clarke, C. J., Gendrin, A., & Sotomayor, M. 2001, MNRAS, 328, 485 [NASA ADS] [CrossRef] [Google Scholar]
- Ercolano, B., & Pascucci, I. 2017, R. Soc. Open Sci., 4, 170114 [Google Scholar]
- Fairlamb, J. R., Oudmaijer, R. D., Mendigutía, I., et al. 2015, MNRAS, 453, 976 [NASA ADS] [CrossRef] [Google Scholar]
- Gaia Collaboration (Prusti, T., et al.) 2016, A&A, 595, A1 [NASA ADS] [CrossRef] [EDP Sciences] [Google Scholar]
- Gaia Collaboration (Brown, A. G. A., et al.) 2018, A&A, 616, A1 [NASA ADS] [CrossRef] [EDP Sciences] [Google Scholar]
- Haffert, S. Y., Bohn, A. J., de Boer, J., et al. 2019, Nat. Astron., 3, 749 [NASA ADS] [CrossRef] [EDP Sciences] [Google Scholar]
- Haisch, K. E., Lada, E. A., & Lada, C. J. 2001, ApJ, 553, L153 [NASA ADS] [CrossRef] [Google Scholar]
- Ingleby, L., Calvet, N., Bergin, E., et al. 2011, ApJ, 743, 105 [NASA ADS] [CrossRef] [Google Scholar]
- Kelly, B. C. 2007, ApJ, 665, 1489 [NASA ADS] [CrossRef] [Google Scholar]
- Keppler, M., Benisty, M., Müller, A., et al. 2018, A&A, 617, A44 [NASA ADS] [CrossRef] [EDP Sciences] [Google Scholar]
- Keppler, M., Teague, R., Bae, J., et al. 2019, A&A, 625, A118 [NASA ADS] [CrossRef] [EDP Sciences] [Google Scholar]
- Kudo, T., Hashimoto, J., Muto, T., et al. 2018, ApJ, 868, L5 [NASA ADS] [CrossRef] [Google Scholar]
- Lynden-Bell, D., & Pringle, J. E. 1974, MNRAS, 168, 603 [NASA ADS] [CrossRef] [Google Scholar]
- Lodato, G., Scardoni, C. E., Manara, C. F., et al. 2017, MNRAS, 472, 4700 [NASA ADS] [CrossRef] [Google Scholar]
- Long, F., Herczeg, G. J., Harsono, D., et al. 2019, ApJ, 882, 49 [NASA ADS] [CrossRef] [Google Scholar]
- Manara, C. F., Testi, L., Rigliaco, E., et al. 2013, A&A, 551, A107 [NASA ADS] [CrossRef] [EDP Sciences] [Google Scholar]
- Manara, C. F., Testi, L., Natta, A., et al. 2014, A&A, 568, A18 [NASA ADS] [CrossRef] [EDP Sciences] [Google Scholar]
- Manara, C. F., Rosotti, G., Testi, L., et al. 2016a, A&A, 591, L3 [NASA ADS] [CrossRef] [EDP Sciences] [Google Scholar]
- Manara, C. F., Fedele, D., Herczeg, G. J., et al. 2016b, A&A, 585, A136 [NASA ADS] [CrossRef] [EDP Sciences] [Google Scholar]
- Manara, C. F., Testi, L., Herczeg, G. J., et al. 2017, A&A, 604, A127 [NASA ADS] [CrossRef] [EDP Sciences] [Google Scholar]
- Manara, C. F., Morbidelli, A., & Guillot, T. 2018, A&A, 618, L3 [NASA ADS] [CrossRef] [EDP Sciences] [Google Scholar]
- Matsuyama, I., Johnstone, D., & Hartmann, L. 2003, ApJ, 582, 893 [NASA ADS] [CrossRef] [Google Scholar]
- Mendigutía, I., Calvet, N., Montesinos, B., et al. 2011, A&A, 535, A99 [NASA ADS] [CrossRef] [EDP Sciences] [Google Scholar]
- Morbidelli, A., & Raymond, S. N. 2016, J. Geophys. Res. (Planets), 121, 1962 [NASA ADS] [CrossRef] [Google Scholar]
- Mordasini, C., Alibert, Y., & Benz, W. 2009, A&A, 501, 1139 [NASA ADS] [CrossRef] [EDP Sciences] [Google Scholar]
- Mordasini, C., Alibert, Y., Klahr, H., et al. 2012, A&A, 547, A111 [NASA ADS] [CrossRef] [EDP Sciences] [Google Scholar]
- Mulders, G. D., Pascucci, I., Manara, C. F., et al. 2017, ApJ, 847, 31 [NASA ADS] [CrossRef] [Google Scholar]
- Mulders, G. D., Mordasini, C., Pascucci, I., et al. 2019, AAS J, submitted [arXiv:1905.08804] [Google Scholar]
- Natta, A., Testi, L., & Randich, S. 2006, A&A, 452, 245 [NASA ADS] [CrossRef] [EDP Sciences] [Google Scholar]
- Owen, J. E., Ercolano, B., & Clarke, C. J. 2011, MNRAS, 412, 13 [NASA ADS] [CrossRef] [Google Scholar]
- Pascucci, I., Testi, L., Herczeg, G. J., et al. 2016, ApJ, 831, 125 [NASA ADS] [CrossRef] [Google Scholar]
- Picogna, G., Ercolano, B., Owen, J. E., et al. 2019, MNRAS, 487, 691 [NASA ADS] [CrossRef] [Google Scholar]
- Pinilla, P., Tazzari, M., Pascucci, I., et al. 2018, ApJ, 859, 32 [Google Scholar]
- Rigliaco, E., Pascucci, I., Duchene, G., et al. 2015, ApJ, 801, 31 [NASA ADS] [CrossRef] [Google Scholar]
- Rosotti, G. P., Ercolano, B., Owen, J. E., et al. 2013, MNRAS, 430, 1392 [NASA ADS] [CrossRef] [Google Scholar]
- Rosotti, G. P., Clarke, C. J., Manara, C. F., & Facchini, S. 2017, MNRAS, 468, 1631 [NASA ADS] [Google Scholar]
- Rosotti, G. P., Tazzari, M., Booth, R. A., et al. 2019, MNRAS, 486, 4829 [NASA ADS] [CrossRef] [Google Scholar]
- Schisano, E., Covino, E., Alcalá, J. M., et al. 2009, A&A, 501, 1013 [NASA ADS] [CrossRef] [EDP Sciences] [Google Scholar]
- Suzuki, D., Bennett, D. P., Ida, S., et al. 2018, ApJ, 869, L34 [NASA ADS] [CrossRef] [Google Scholar]
- Tychoniec, Ł., Tobin, J. J., Karska, A., et al. 2018, ApJS, 238, 19 [NASA ADS] [CrossRef] [Google Scholar]
- Williams, J. P., & Cieza, L. A. 2011, ARA&A, 49, 67 [NASA ADS] [CrossRef] [Google Scholar]
Appendix A: Observational data used in the paper
We report the values of Ṁacc and Mdust used in this work. The latter is converted to Mdisk assuming a gas-to-dust ratio of 100. All the values have been rescaled with respect to their original papers using the more recent Gaia DR2 distances (Gaia Collaboration 2018). The information for the targets in the Lupus region (Table A.1) are taken from Alcalá et al. (2014, 2017) for the accretion properties, and from Ansdell et al. (2016) for the disk masses. As discussed in the text, the latter are rescaled to the same opacities used in other works (Andrews et al. 2013). The accretion parameters for the Chamaeleon I targets are taken from Manara et al. (2016b, 2017), while the disk masses are taken from Pascucci et al. (2016); these are reported in Table A.2.
Stellar and disk masses for the Lupus targets used.
Stellar and disk masses for the Chamaeleon I targets used.
The properties for the transition disks (Table A.3) mainly come from the compilation of Pinilla et al. (2018); the references for the accretion rates are reported in the table. In addition to that, accretion rates and disk masses for PDS70 are reported (Keppler et al. 2018; Haffert et al. 2019); those for HD142666 are reported as well.
Stellar and disk masses for the transition disks used here.
All Tables
All Figures
|
Fig. 1. Mass accretion rate vs. disk mass predicted by 2 Myr old disk models used in planetary synthesis population models (orange filled circles). A, B, and C show the three main loci described in the text. |
| In the text | |
|
Fig. 2. Mass accretion rate vs. disk mass for the models (filled circles) and for the observed population of disks in the Lupus (blue symbols) and Chamaeleon I (red symbols) regions. Squares are used for disks with measured disk mass and mass accretion rates; squares with arrow report upper limits on the disk mass; downward facing triangles report dubious accretors, i.e., objects with mass accretion rates compatible with chromospheric emission; and the transition disks are highlighted with a circle around the symbol. The red line indicates the best fit. The models are colored for the number of giant planets (Mplanet > 300 M⊕) in the system: orange for no giant planets, cyan for one giant planet, gray for two giant planets, and brown for three giant planets. |
| In the text | |
|
Fig. 3. Mass accretion rate vs. disk mass for the models (filled circles, colors as in Fig. 2) and for transition disks with resolved cavities. The pink symbols show transition disks around T Tauri stars and the violet symbols the transition disks around Herbig stars from Pinilla et al. (2018). The gray star symbol refers to PDS 70. Other symbols as in Fig. 2. |
| In the text | |
Current usage metrics show cumulative count of Article Views (full-text article views including HTML views, PDF and ePub downloads, according to the available data) and Abstracts Views on Vision4Press platform.
Data correspond to usage on the plateform after 2015. The current usage metrics is available 48-96 hours after online publication and is updated daily on week days.
Initial download of the metrics may take a while.