Fig. 2.
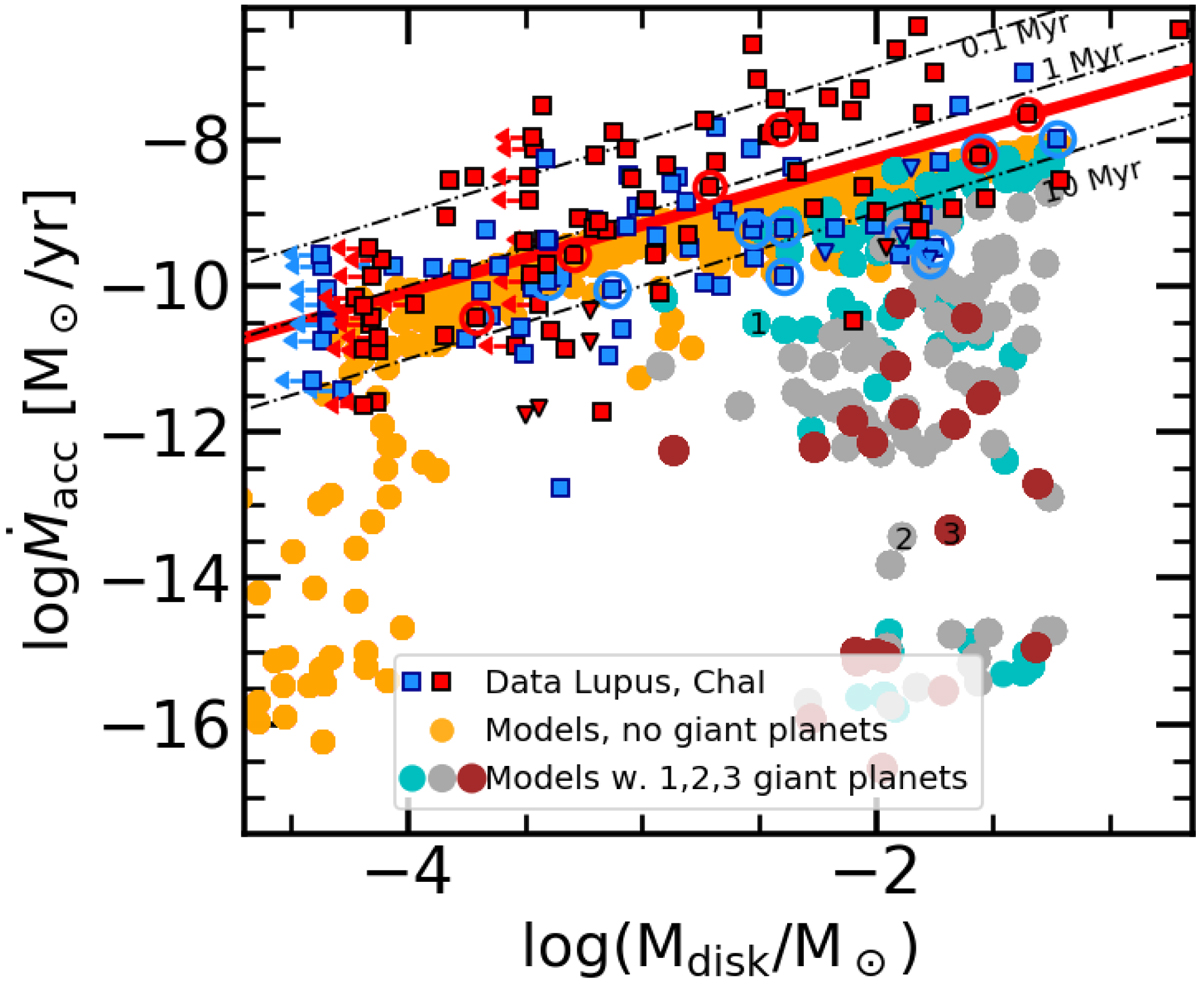
Mass accretion rate vs. disk mass for the models (filled circles) and for the observed population of disks in the Lupus (blue symbols) and Chamaeleon I (red symbols) regions. Squares are used for disks with measured disk mass and mass accretion rates; squares with arrow report upper limits on the disk mass; downward facing triangles report dubious accretors, i.e., objects with mass accretion rates compatible with chromospheric emission; and the transition disks are highlighted with a circle around the symbol. The red line indicates the best fit. The models are colored for the number of giant planets (Mplanet > 300 M⊕) in the system: orange for no giant planets, cyan for one giant planet, gray for two giant planets, and brown for three giant planets.
Current usage metrics show cumulative count of Article Views (full-text article views including HTML views, PDF and ePub downloads, according to the available data) and Abstracts Views on Vision4Press platform.
Data correspond to usage on the plateform after 2015. The current usage metrics is available 48-96 hours after online publication and is updated daily on week days.
Initial download of the metrics may take a while.