Fig. 2.
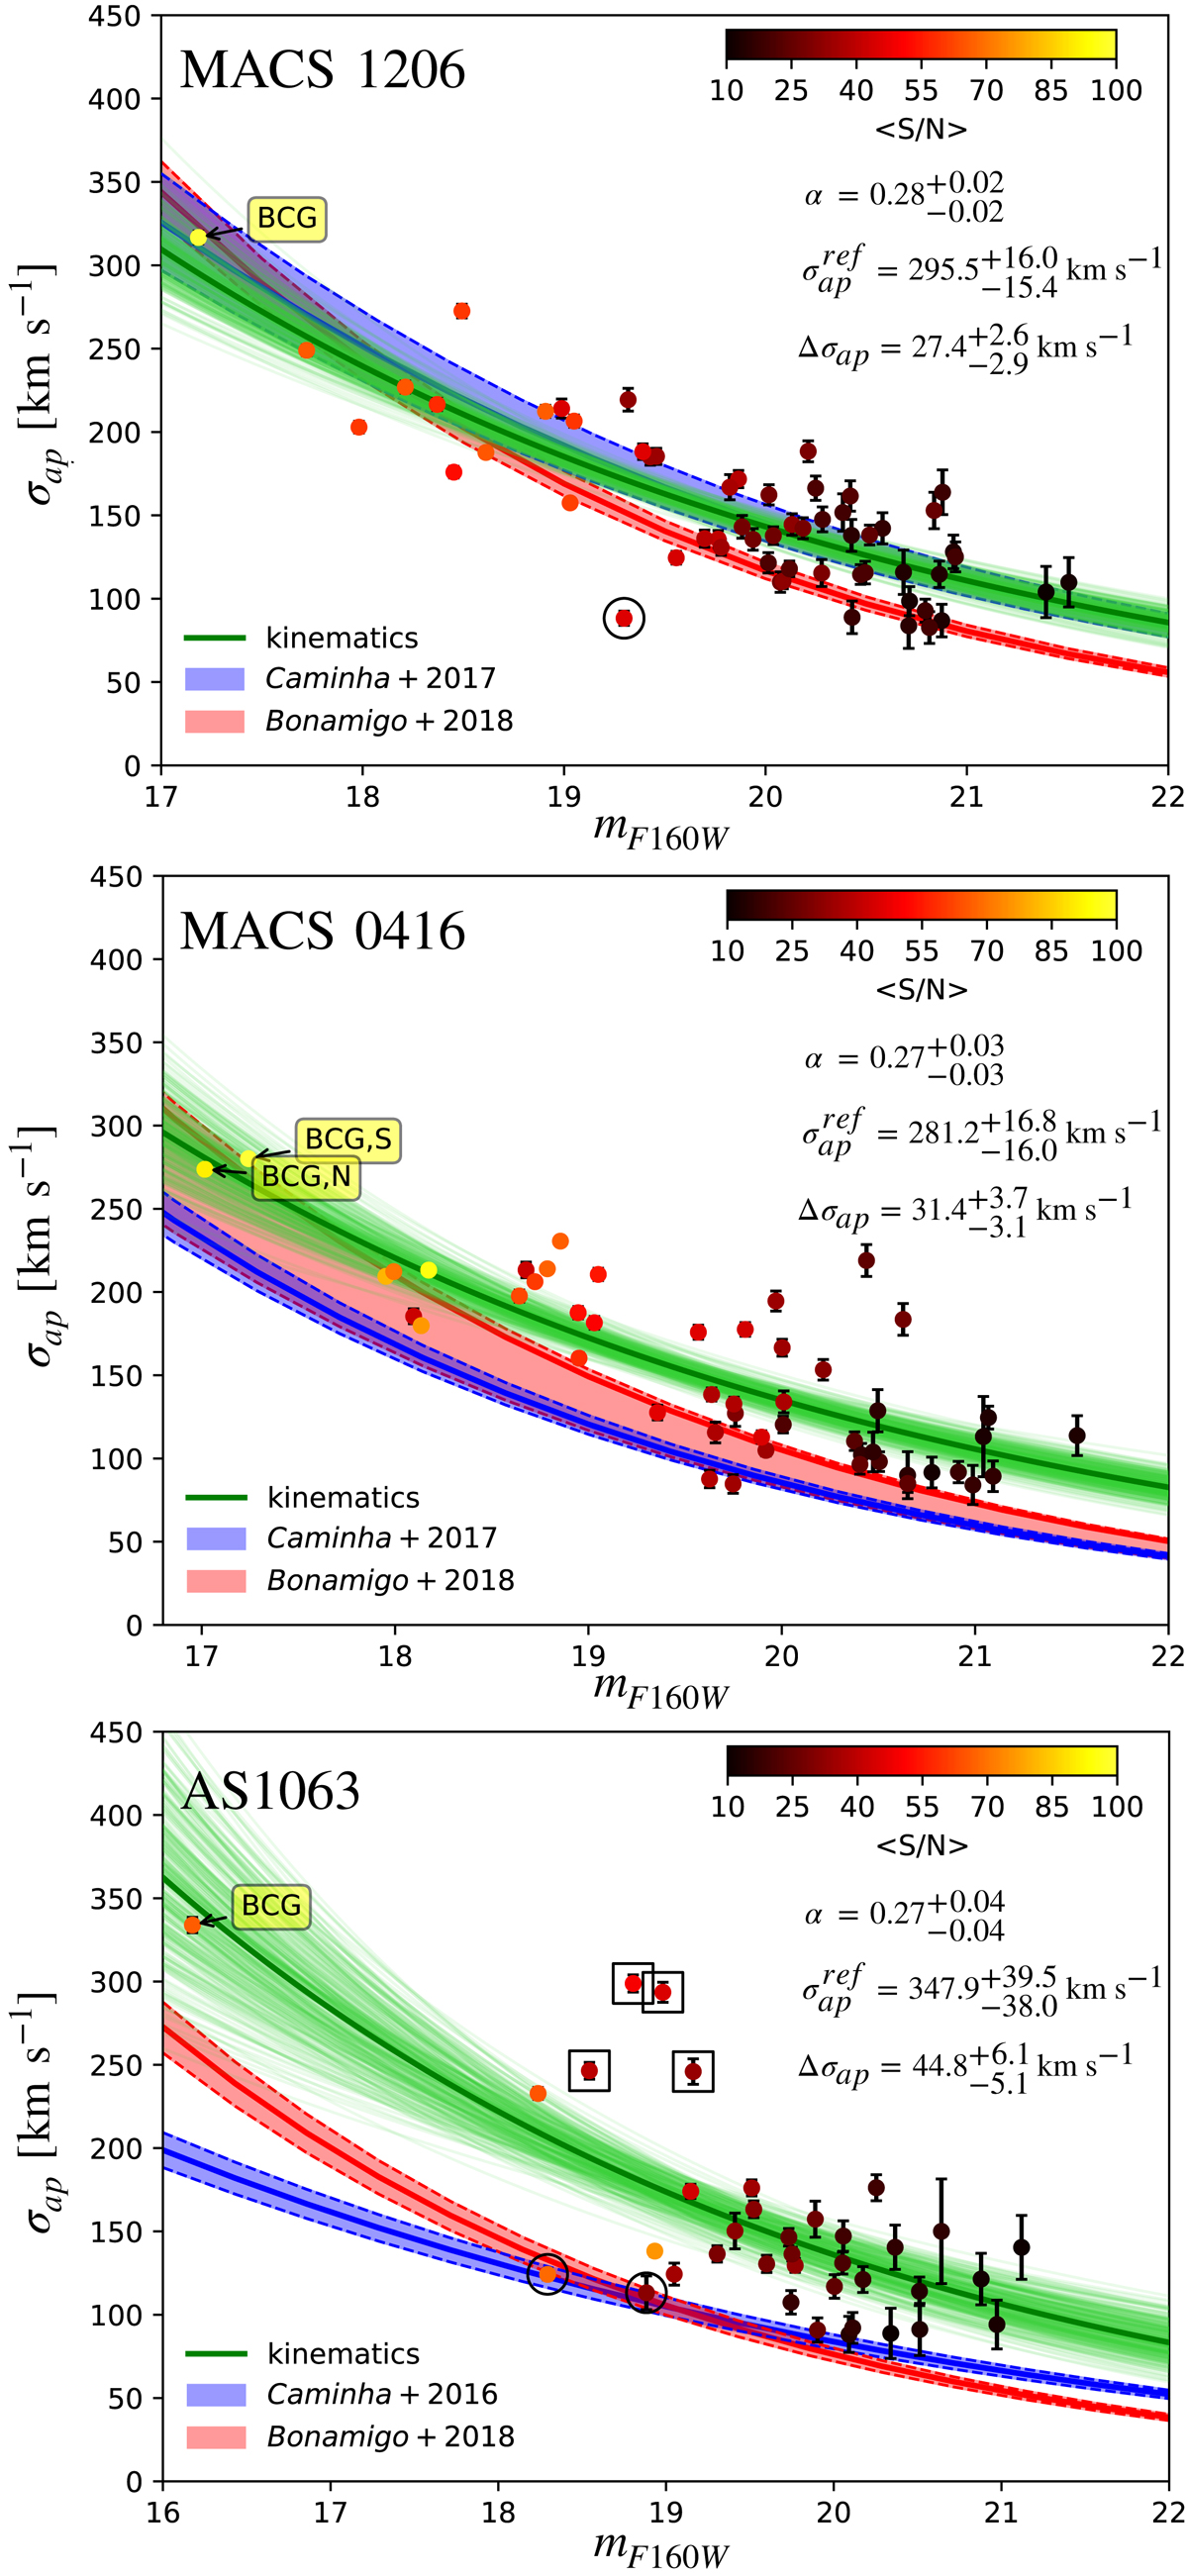
Data points are measured stellar velocity dispersions of cluster members, color-coded according to their spectral ⟨S/N⟩. Green lines are 300 scaling relations randomly drawn from the posterior distributions of the σap–mag scaling relation parameters, α, ![]() , Δσap, obtained from fitting the data points (see Fig. 3). Optimized parameters are also quoted. Red and blue areas are obtained by projecting the 3D σ–L scaling relations from our previous lens models with no kinematic prior (see text). Some velocity dispersion measurements, which deviate significantly from the scaling relations, are marked with squares and circles and discussed in the text.
, Δσap, obtained from fitting the data points (see Fig. 3). Optimized parameters are also quoted. Red and blue areas are obtained by projecting the 3D σ–L scaling relations from our previous lens models with no kinematic prior (see text). Some velocity dispersion measurements, which deviate significantly from the scaling relations, are marked with squares and circles and discussed in the text.
Current usage metrics show cumulative count of Article Views (full-text article views including HTML views, PDF and ePub downloads, according to the available data) and Abstracts Views on Vision4Press platform.
Data correspond to usage on the plateform after 2015. The current usage metrics is available 48-96 hours after online publication and is updated daily on week days.
Initial download of the metrics may take a while.