Fig. C.3.
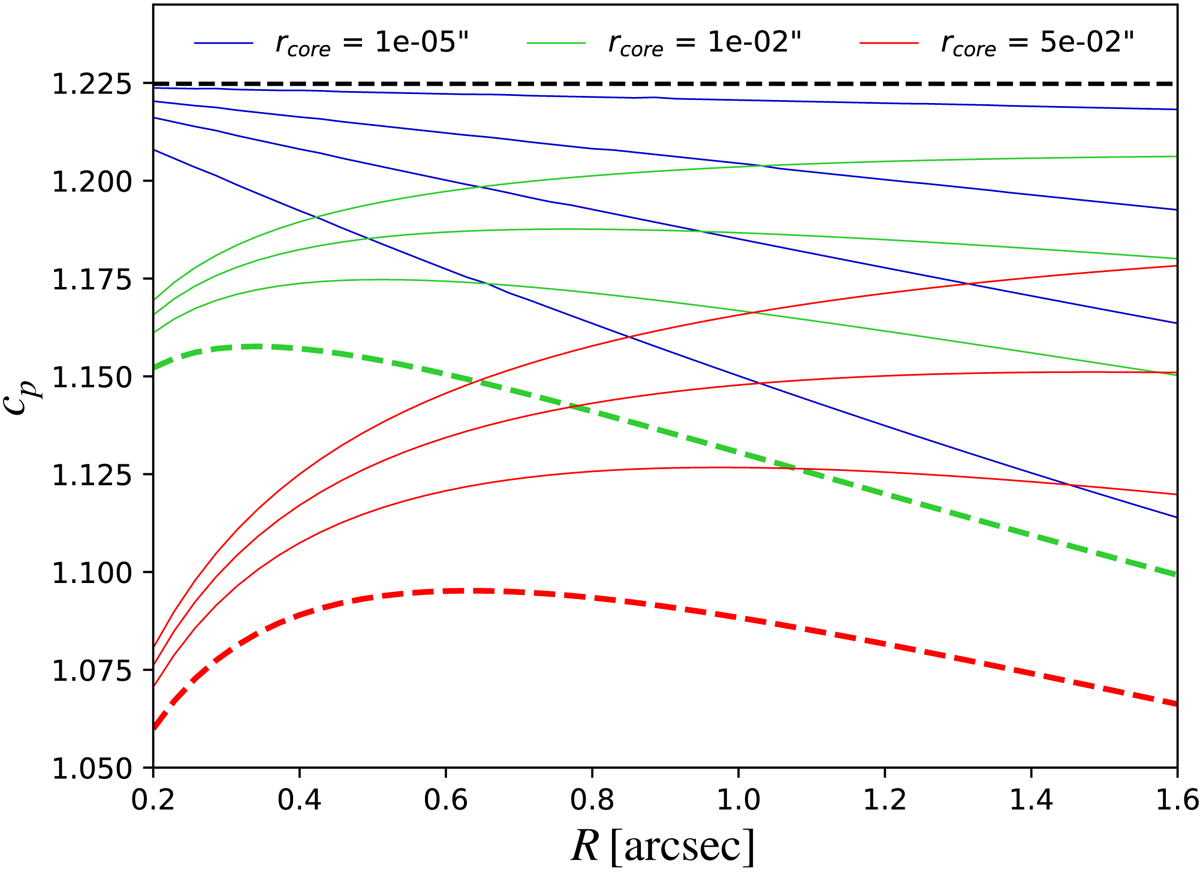
Projection coefficient cp as a function of aperture radius R in arcseconds. Curves associated to the same rcore are grouped with the same color, with rcut = 5, 10, 20, 100 arcsec, from bottom to top. The thick dashed red and green lines correspond to typical values of rcore and rcut derived from our lensing+dynamics modeling of clusters. The dashed black horizontal line corresponds to ![]() .
.
Current usage metrics show cumulative count of Article Views (full-text article views including HTML views, PDF and ePub downloads, according to the available data) and Abstracts Views on Vision4Press platform.
Data correspond to usage on the plateform after 2015. The current usage metrics is available 48-96 hours after online publication and is updated daily on week days.
Initial download of the metrics may take a while.