Fig. 1.
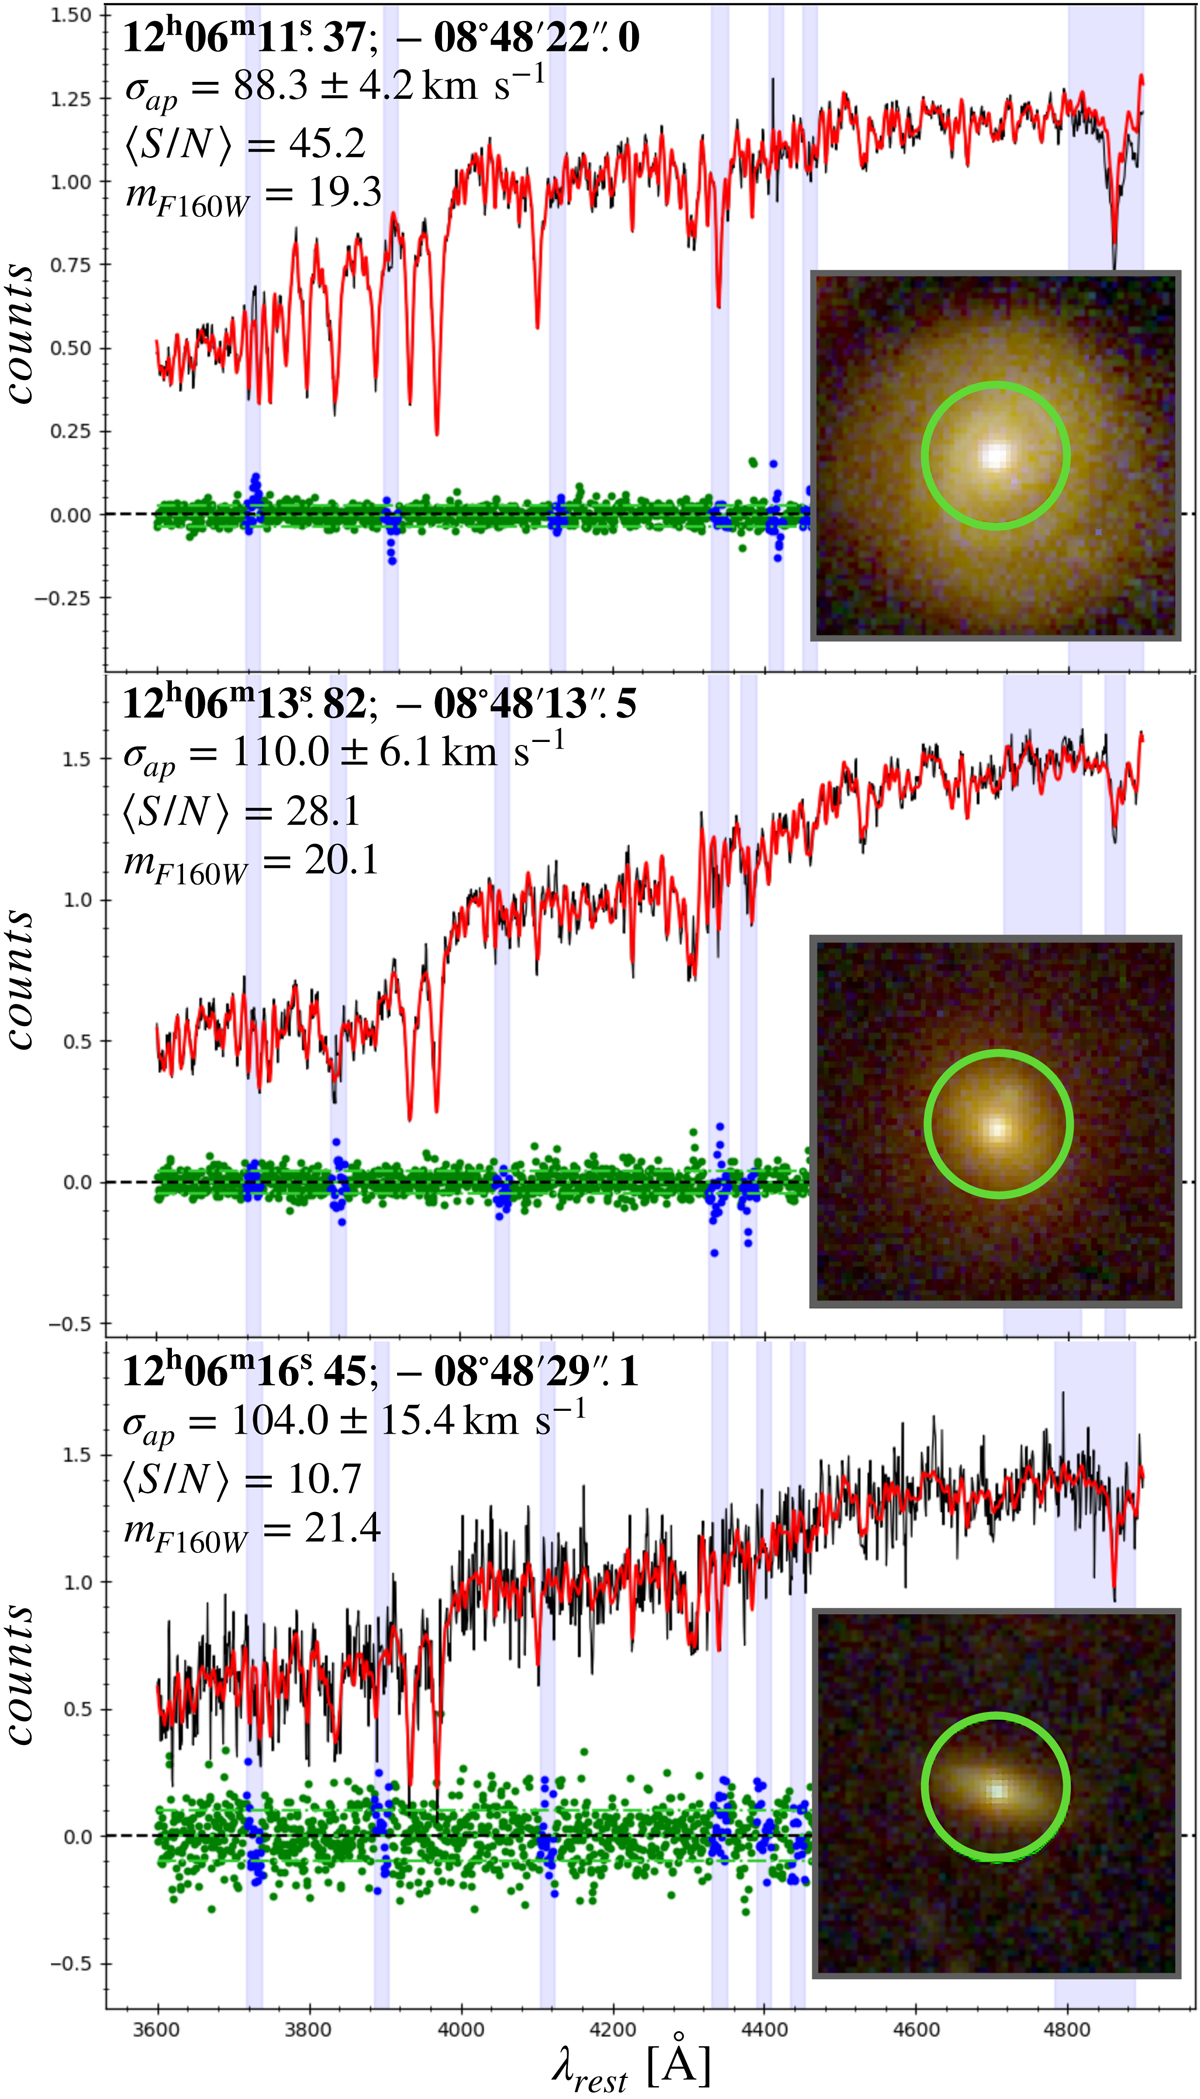
Results from line-of-sight velocity dispersion fitting of spectra of three cluster members in MACS 1206 as obtained with pPXF. Galaxy spectra are shown in black; red curves are the pPXF best-fit models, while the green points correspond to the data−model residuals. The blue shaded regions along the wavelength axis were excluded in the fitting procedure due to the presence of noisy sky subtractions around emission lines in the spectra. Corresponding residuals in these regions are marked in blue. The first from the top is a high signal-to-noise E+A galaxy. The second is a passive galaxy spectrum with a ⟨S/N⟩ = 28.1, corresponding approximately to the mean S/N of our galaxy sample. The bottom spectrum has a ⟨S/N⟩ = 10.7, close to our lower limit for reliable velocity dispersion measurements. Coordinates, measured velocity dispersion (σap), mean signal-to-noise and F160W magnitudes are indicated in each panel. Cutouts are HST RGB images, 4″ across, showing in green the apertures of 0.8″ radius used for the spectral extraction.
Current usage metrics show cumulative count of Article Views (full-text article views including HTML views, PDF and ePub downloads, according to the available data) and Abstracts Views on Vision4Press platform.
Data correspond to usage on the plateform after 2015. The current usage metrics is available 48-96 hours after online publication and is updated daily on week days.
Initial download of the metrics may take a while.