Fig. 3.
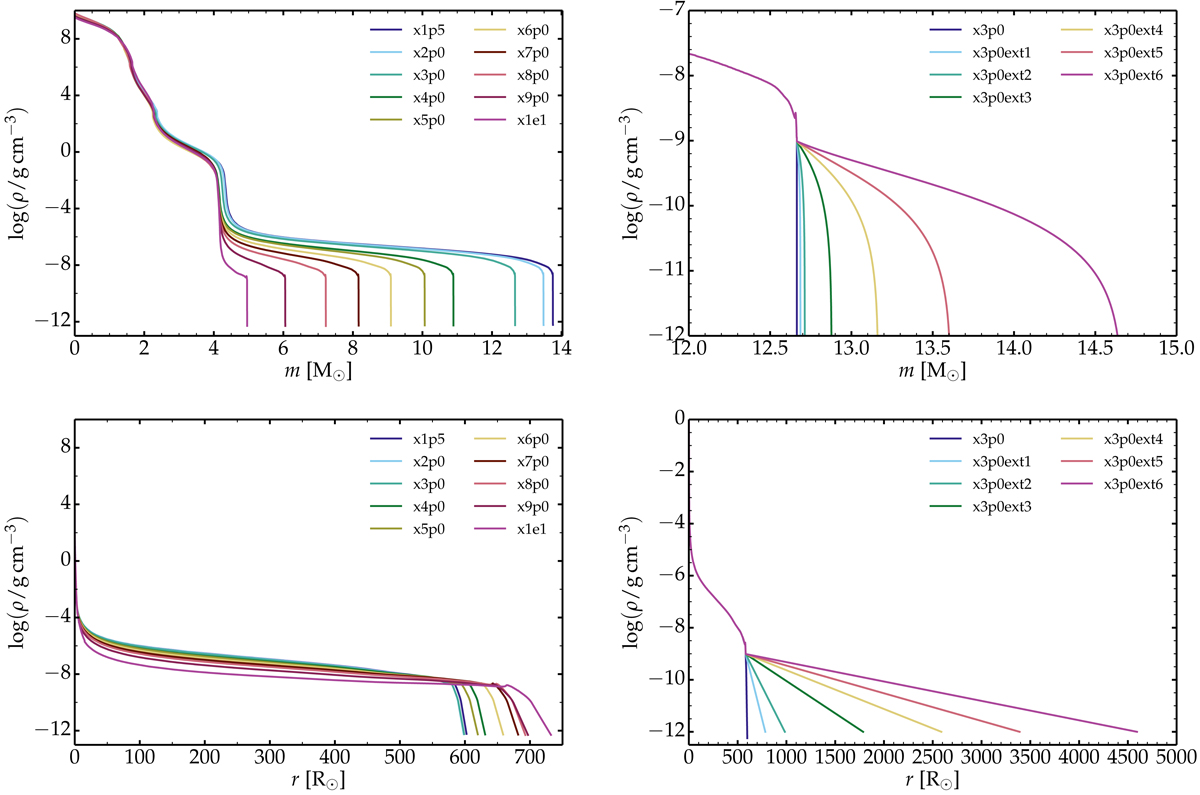
Left: mass density versus Lagrangian mass (top) and radius (bottom) at the onset of core collapse for the set of 15 M⊙ simulations produced with MESA using a mixing-length parameter of 3 and a variety of mass-loss rate scalings during the RSG phase. Right: same as left, but now for variants of model x3p0 in which some CSM has been added. The corresponding model properties are given in Table 2.
Current usage metrics show cumulative count of Article Views (full-text article views including HTML views, PDF and ePub downloads, according to the available data) and Abstracts Views on Vision4Press platform.
Data correspond to usage on the plateform after 2015. The current usage metrics is available 48-96 hours after online publication and is updated daily on week days.
Initial download of the metrics may take a while.