Fig. 2.
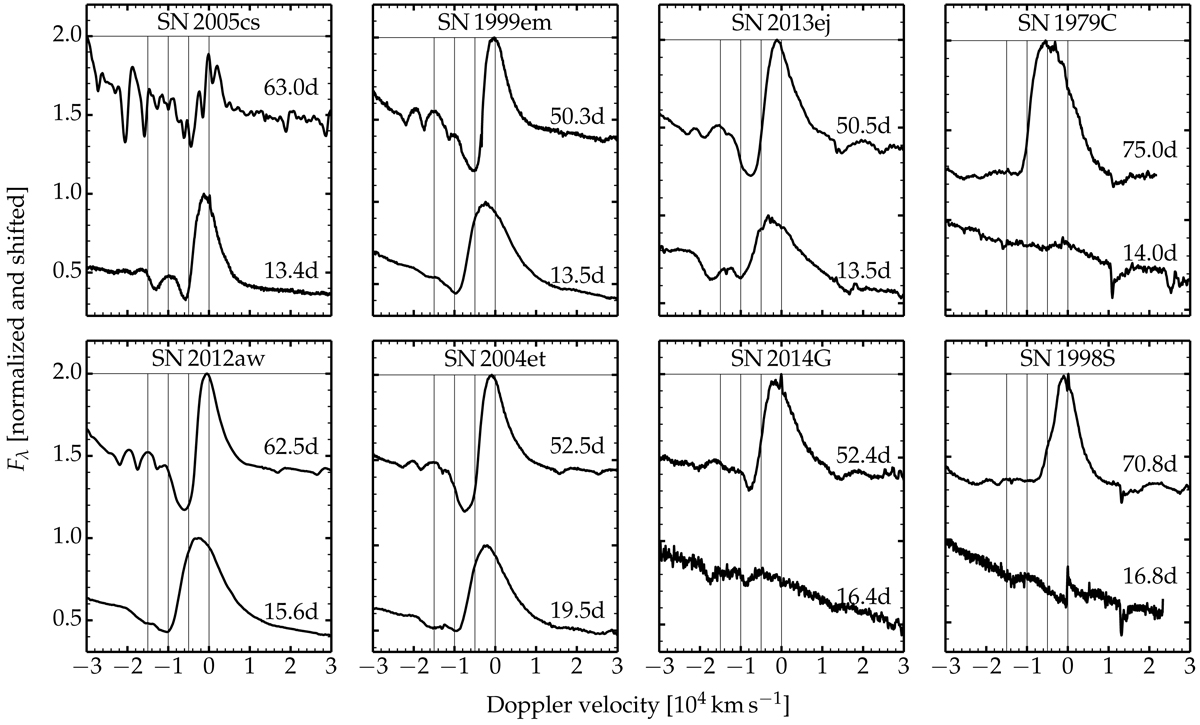
Comparison of spectra in the Hα region at about 15 and 60 d after the inferred time of explosion for a set of observed Type II SNe with a range of V-band decline rates during the photospheric phase. The spectra have been normalized so that the peak value (in the spectral window shown) is unity, with an additional offset of unity for the upper spectrum. Left-most two columns: standard Type II SNe with a slow decline rate. Third column: SNe that exhibit a much larger brightness at early times followed by a fast decline. Rightmost column: SNe with a huge early-time brightness and a fast decline rate at all times. The photometric differences between these families of events have a clear spectroscopic counterpart (see Sect. 2.3 for discussion).
Current usage metrics show cumulative count of Article Views (full-text article views including HTML views, PDF and ePub downloads, according to the available data) and Abstracts Views on Vision4Press platform.
Data correspond to usage on the plateform after 2015. The current usage metrics is available 48-96 hours after online publication and is updated daily on week days.
Initial download of the metrics may take a while.