Fig. 12.
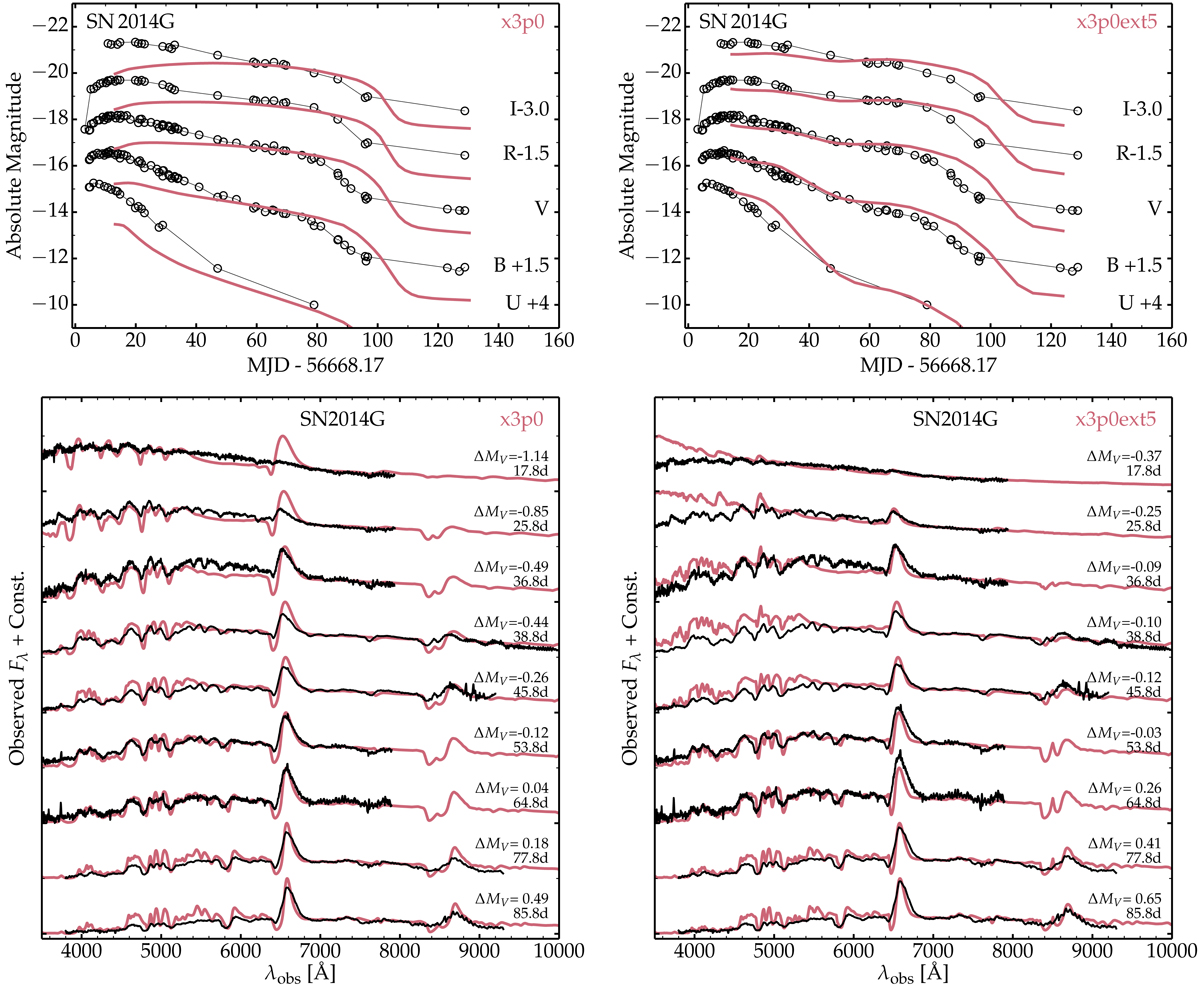
Same as Fig. 8, but now showing a comparison of SN 2014G with the model x3p0 (no CSM; left) and model x3p0ext5 (with CSM; right). The model with the CSM shows much better agreement with the observations – the light curve is better matched at earlier times, the weak Hα P Cygni profiles are in better agreement with observations, and the emission at early times is either weak or absent.
Current usage metrics show cumulative count of Article Views (full-text article views including HTML views, PDF and ePub downloads, according to the available data) and Abstracts Views on Vision4Press platform.
Data correspond to usage on the plateform after 2015. The current usage metrics is available 48-96 hours after online publication and is updated daily on week days.
Initial download of the metrics may take a while.