Fig. 1.
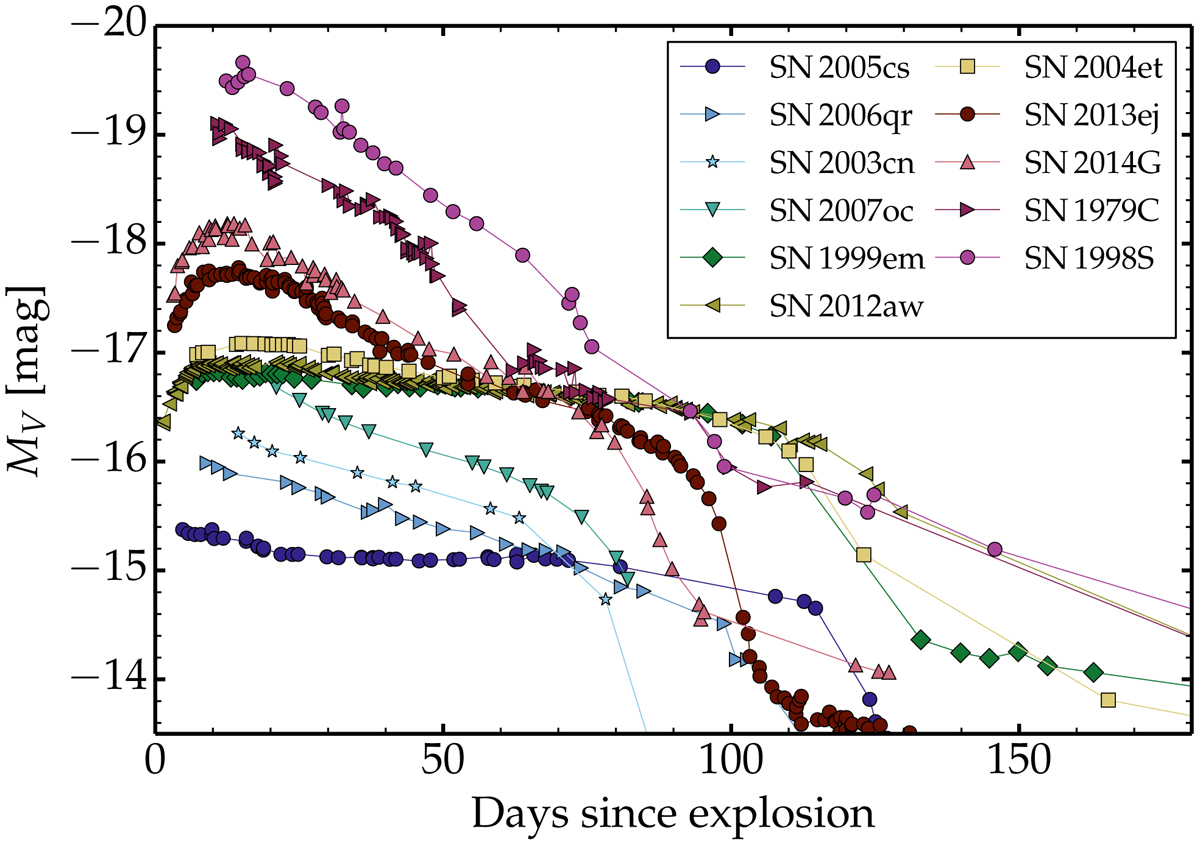
Sample of observed V-band light curves, corrected for extinction and reddening, illustrating the well known diversity of Type II SNe (e.g., Patat et al. 1994; Pastorello et al. 2004). This diversity is representative of that shown in Anderson et al. (2014), revealing Type II SNe with a range of brightness, decline rate, and duration in their high-brightness phase. The plotting order progresses from faint to bright events at maximum (see Sect. 2.2 for discussion).
Current usage metrics show cumulative count of Article Views (full-text article views including HTML views, PDF and ePub downloads, according to the available data) and Abstracts Views on Vision4Press platform.
Data correspond to usage on the plateform after 2015. The current usage metrics is available 48-96 hours after online publication and is updated daily on week days.
Initial download of the metrics may take a while.