Fig. 9
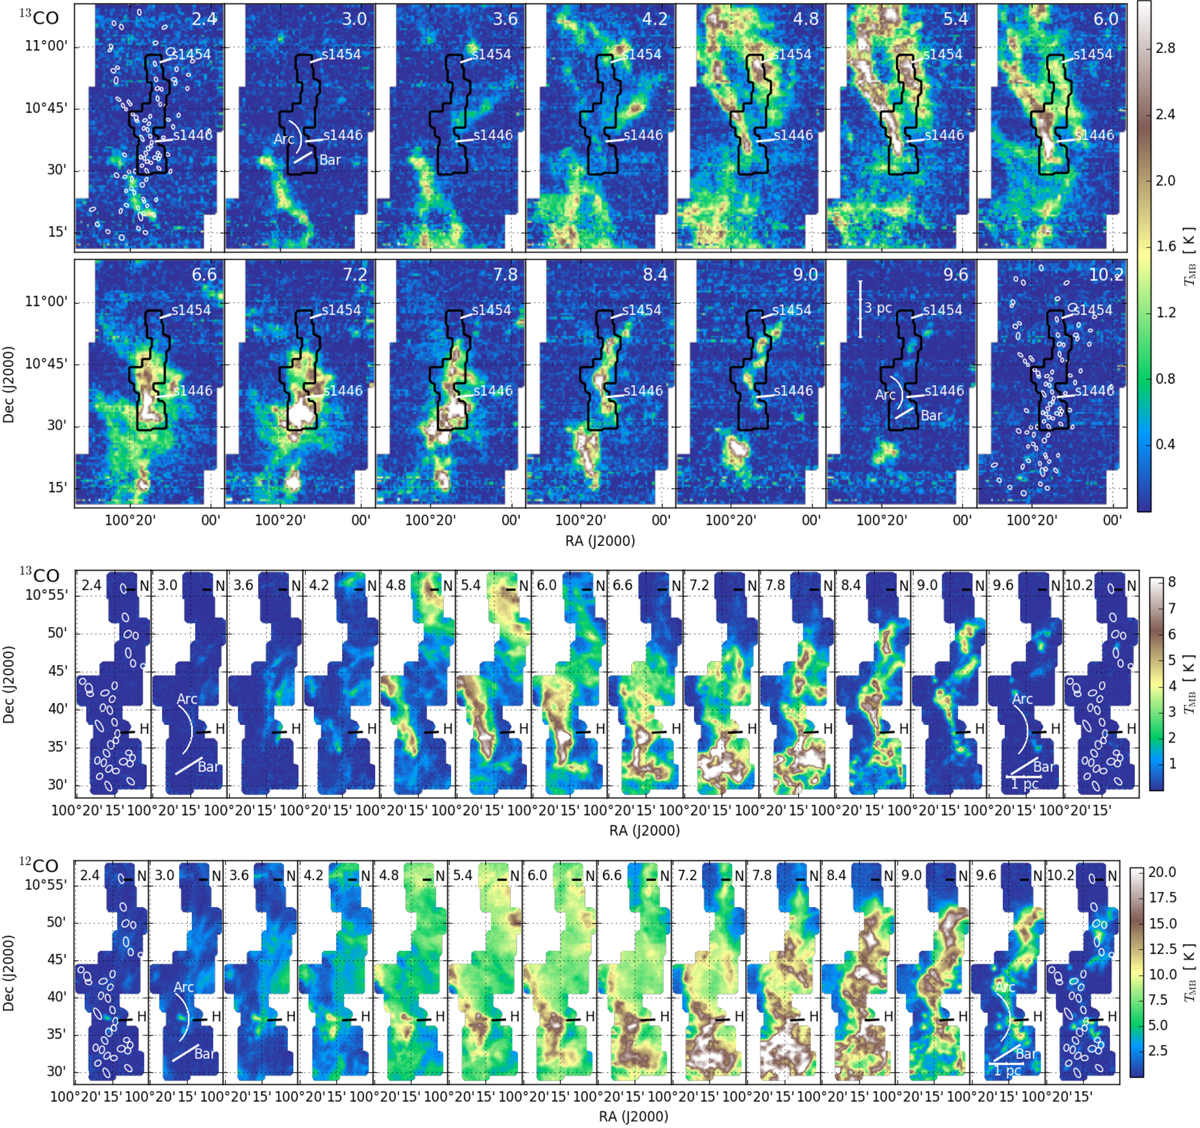
Top: 13CO channel maps from TRAO data. Middle: 13CO channel maps from IRAM data. Bottom: 12CO channel maps from IRAM data. The channel velocities are written in the top corners. In the two first and last frames, the sources from the GCC catalogue are shown as white ellipses and the arc and bar regions are shown as white lines. The north clump and NGC 2264 H are labelled as “s1454” and “s1446” in TRAO maps, and “N” and “H” in IRAM maps, respectively.Scale bars are in the next to last frames.
Current usage metrics show cumulative count of Article Views (full-text article views including HTML views, PDF and ePub downloads, according to the available data) and Abstracts Views on Vision4Press platform.
Data correspond to usage on the plateform after 2015. The current usage metrics is available 48-96 hours after online publication and is updated daily on week days.
Initial download of the metrics may take a while.