Fig. 7
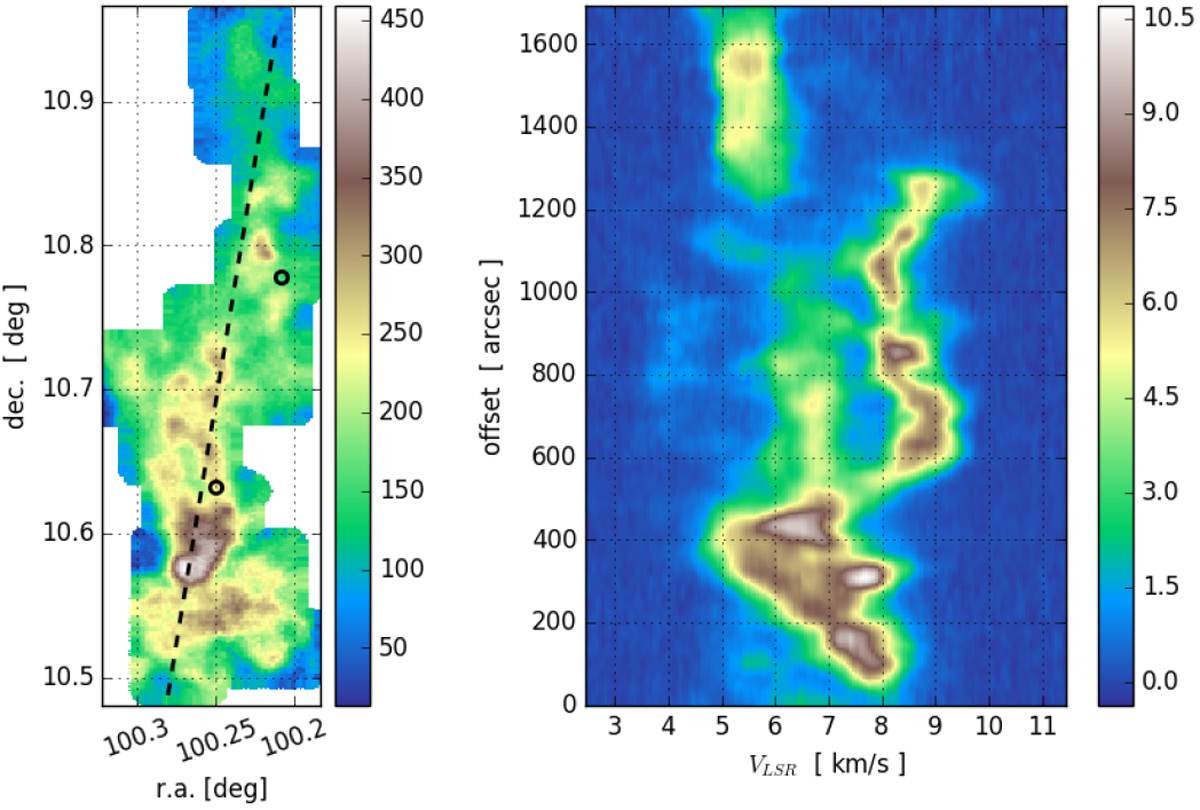
Left: velocity integrated map of 13CO in K km s−1. Right: position-velocity diagram along the dashed line of the left frame. The two circles on the map in the left frame show the locations of the spectra shown in Fig. 8.
Current usage metrics show cumulative count of Article Views (full-text article views including HTML views, PDF and ePub downloads, according to the available data) and Abstracts Views on Vision4Press platform.
Data correspond to usage on the plateform after 2015. The current usage metrics is available 48-96 hours after online publication and is updated daily on week days.
Initial download of the metrics may take a while.