Fig. 6
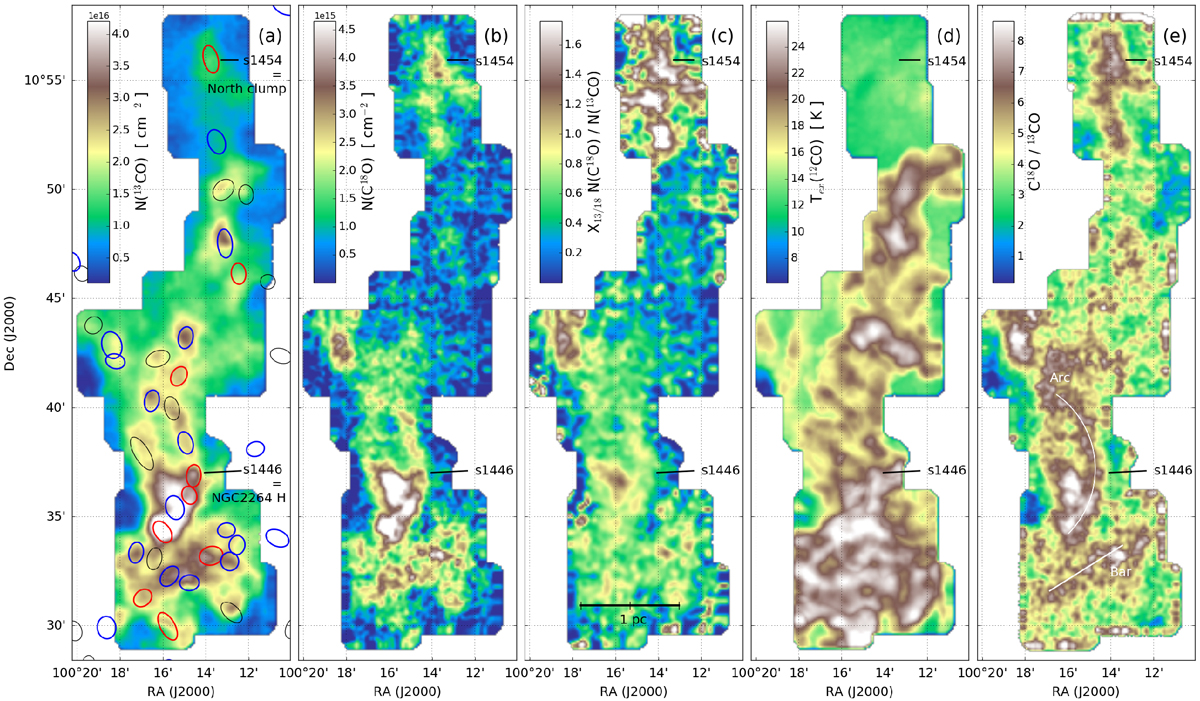
Column density maps of 13CO (frame a) and C18O (frame b), and their ratio (frame c) normalised to the expected 13CO/C18O from Wilson & Rood (1994). Frame d: Excitation temperature of 12CO.
Frame e: Integrated ![]() ratio. The sources s1454 (north clump) and s1446 (NGC 2264 H) are indicated in each frame. The ellipses in frame a
show the GCC sources with the same colour code as in Fig. 2: red for protostellar, blue for starless, and black for undetermined. A scale bar is shown in frame c. The structures named “the arc” and “the bar” are shown in
frame e.
ratio. The sources s1454 (north clump) and s1446 (NGC 2264 H) are indicated in each frame. The ellipses in frame a
show the GCC sources with the same colour code as in Fig. 2: red for protostellar, blue for starless, and black for undetermined. A scale bar is shown in frame c. The structures named “the arc” and “the bar” are shown in
frame e.
Current usage metrics show cumulative count of Article Views (full-text article views including HTML views, PDF and ePub downloads, according to the available data) and Abstracts Views on Vision4Press platform.
Data correspond to usage on the plateform after 2015. The current usage metrics is available 48-96 hours after online publication and is updated daily on week days.
Initial download of the metrics may take a while.