Fig. 5
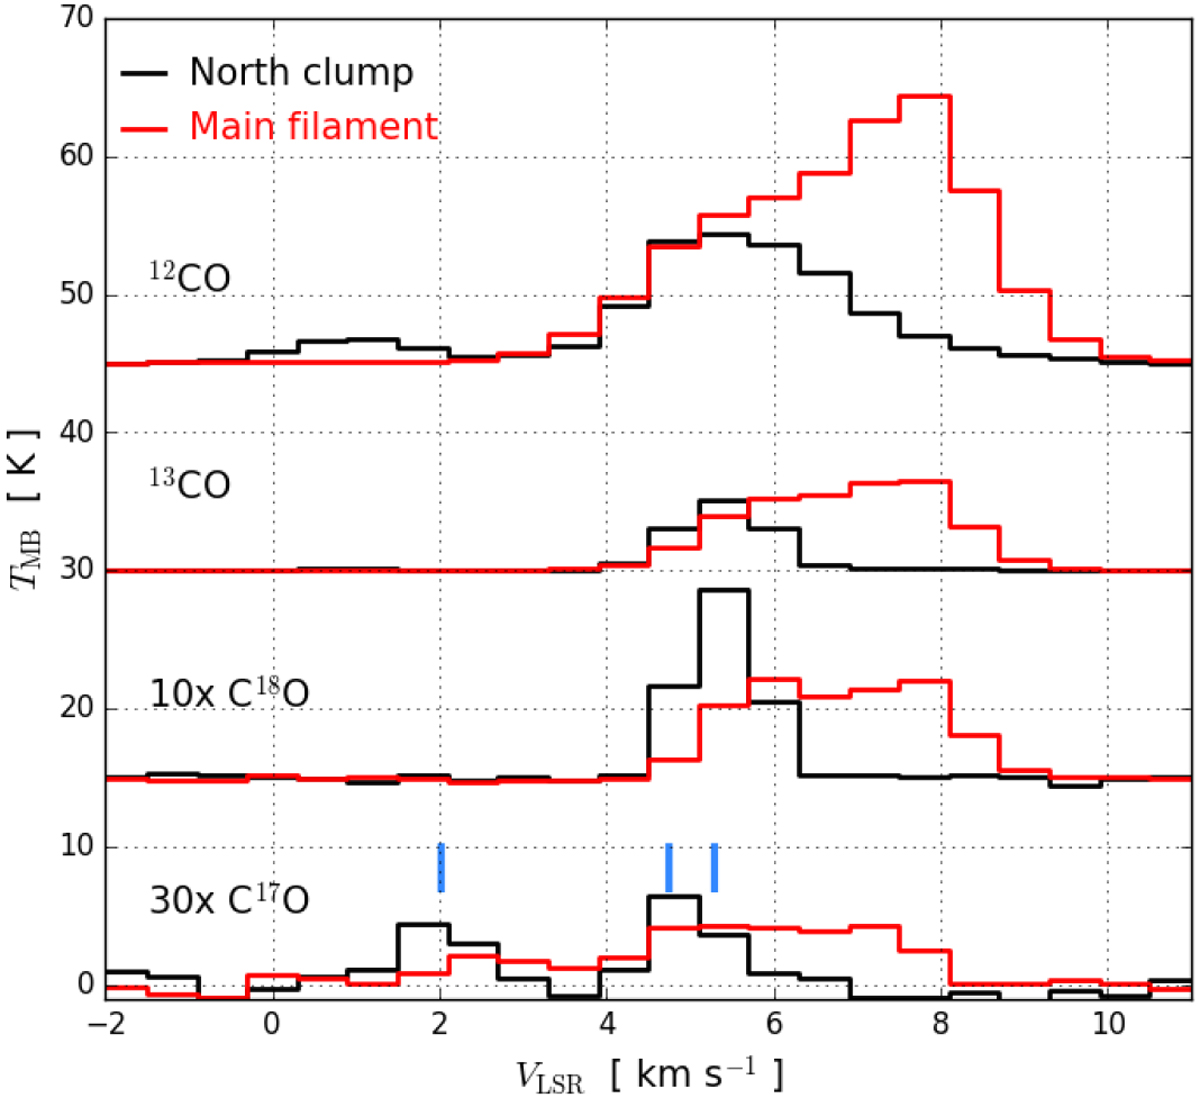
Spectra of CO isotopologues in the north clump (black) and in the main filament (red). Spectra are averaged within 2 arcmin-wide square regions centred at (α, δ) = (6:40:54.9;+10:55:40.8) for the north clump and (α, δ) = (6:41:03.6;+10:34:28.7) for the main filament. In the C17O (J = 1–0) transition, the three vertical blue lines indicate the positions of the three hyperfine components assuming vlsr = 5.3 km s−1.
Current usage metrics show cumulative count of Article Views (full-text article views including HTML views, PDF and ePub downloads, according to the available data) and Abstracts Views on Vision4Press platform.
Data correspond to usage on the plateform after 2015. The current usage metrics is available 48-96 hours after online publication and is updated daily on week days.
Initial download of the metrics may take a while.