Fig. 3
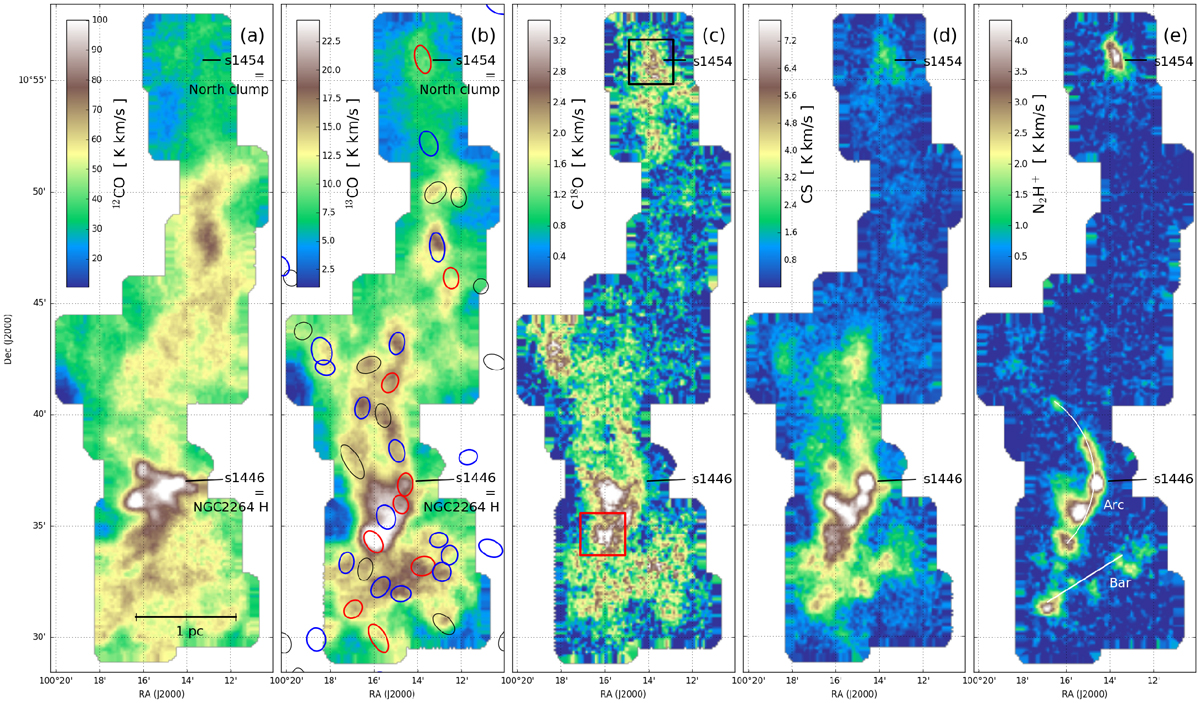
Integrated intensity maps of the main detected lines in our IRAM observations. The sources s1454 (North clump) and s1446 (NGC 2264 H) are indicated in each frame. A scale bar is shown in frame a. The ellipses in frame b show the GCC sources with the same colour code as in Fig. 2: red for protostellar, blue for starless, and black for undetermined. The black and red squares in frame c show the areas where the average spectra in Fig. 5 were computed. The structures named “the arc” and “the bar” are shown in frame e.
Current usage metrics show cumulative count of Article Views (full-text article views including HTML views, PDF and ePub downloads, according to the available data) and Abstracts Views on Vision4Press platform.
Data correspond to usage on the plateform after 2015. The current usage metrics is available 48-96 hours after online publication and is updated daily on week days.
Initial download of the metrics may take a while.