Fig. 2
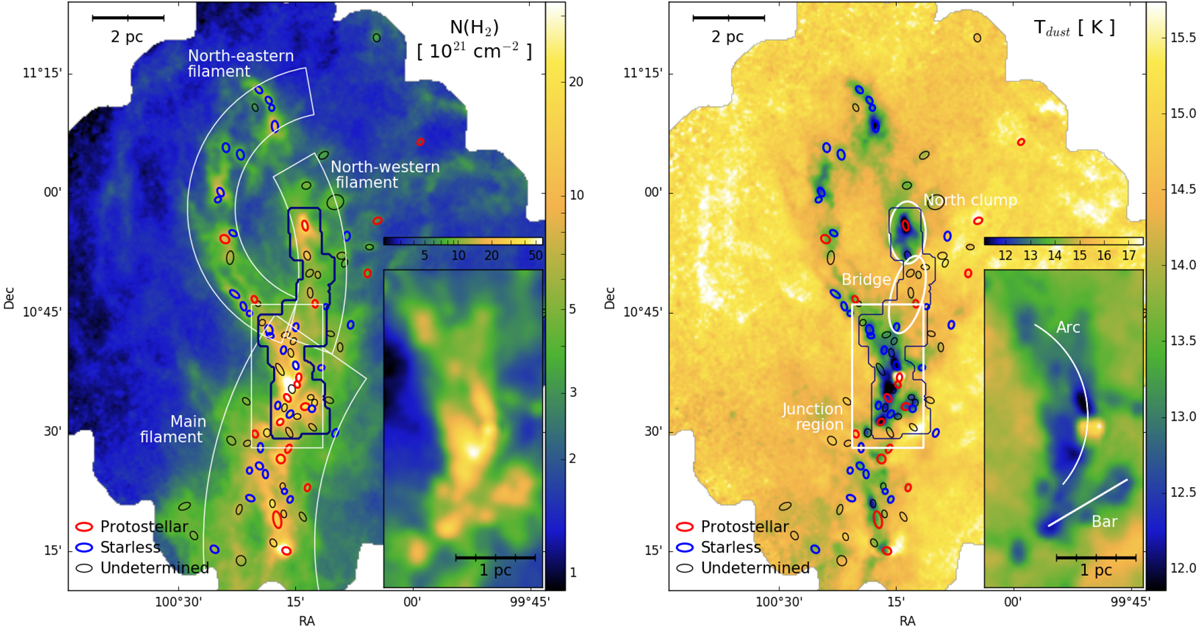
Left: column density of molecular hydrogen in G202.3+2.5 as derived from SPIRE bands, assuming a modified black-body SED with fixed β = 2. Right: dust temperature in G202.3+2.5 derived from the same SED fitting. In both frames, the dark-blue solid line shows the footprint of our IRAM OTF observations, and the ellipses show the location, size (full-width at half-maximum of a Gaussian fit) and orientation of the submillimetre compact sources extracted by Montillaud et al. (2015). The regions defined in the main text are indicated with white shapes. In both frames, the inset shows a zoom to the junction region (white rectangle).
Current usage metrics show cumulative count of Article Views (full-text article views including HTML views, PDF and ePub downloads, according to the available data) and Abstracts Views on Vision4Press platform.
Data correspond to usage on the plateform after 2015. The current usage metrics is available 48-96 hours after online publication and is updated daily on week days.
Initial download of the metrics may take a while.