Fig. 15
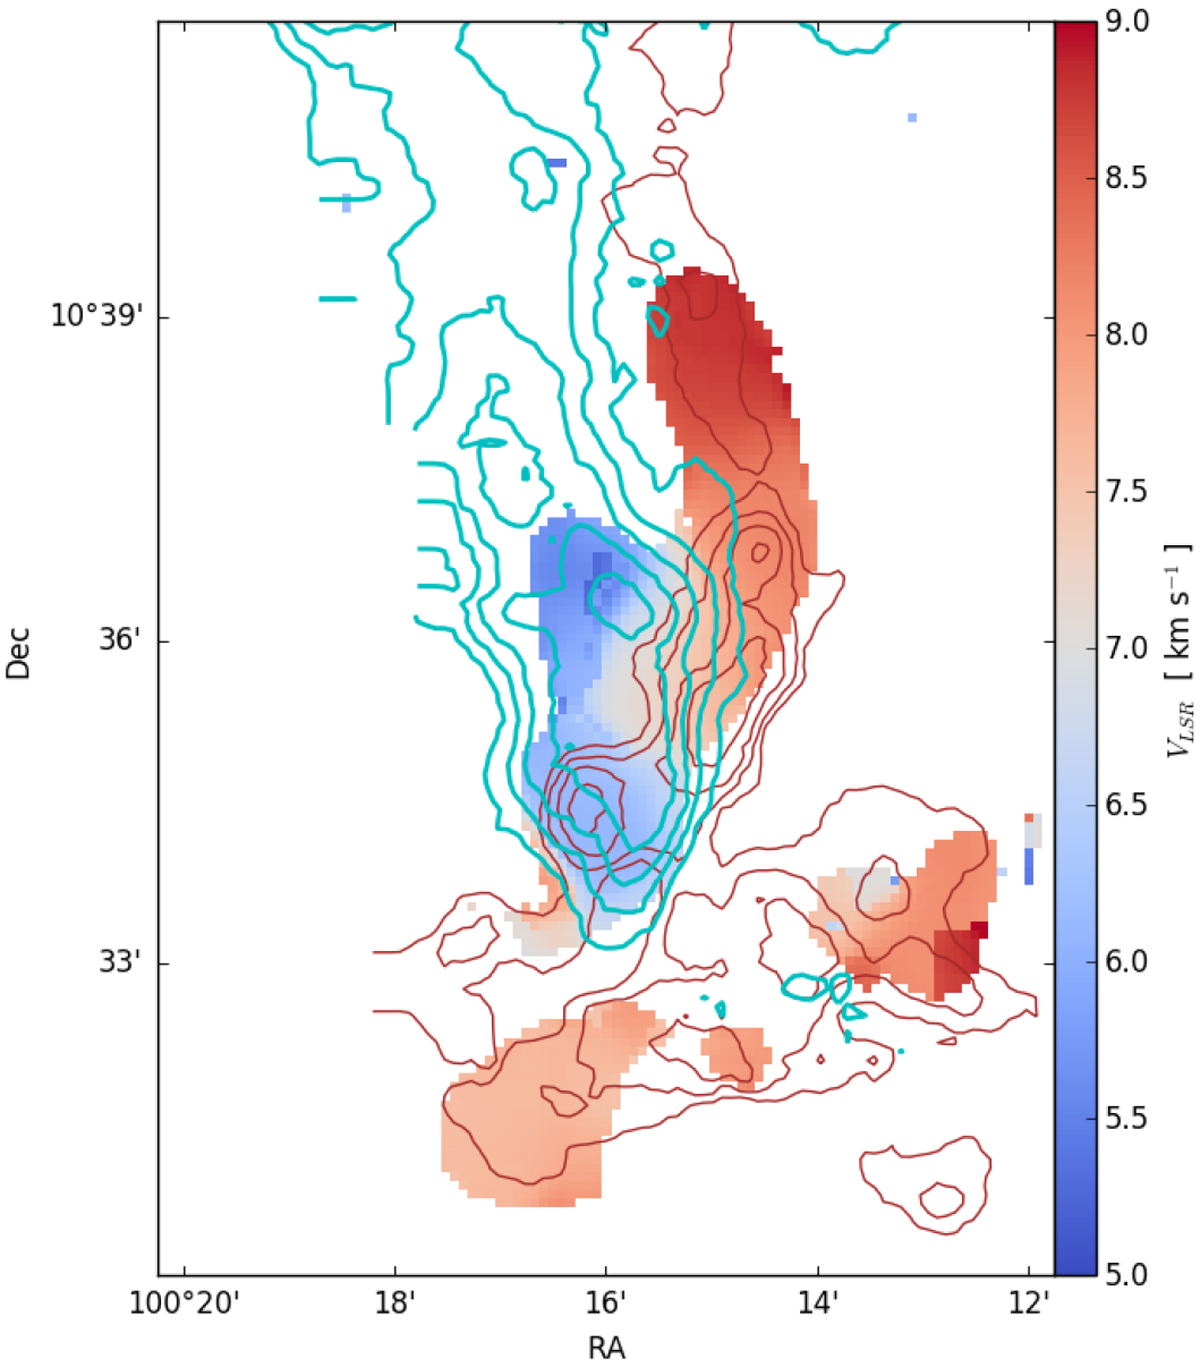
Centroid map of the isolated hyperfine component of N2H+ in the junction region. The light blue and dark red lines show the contours of the 13CO emission from the IRAM data integrated between 3.6 and 6.0 km s−1, and between 6.3 and 9.3 km s−1, corresponding to the north-eastern filament and the main filament, respectively. The levels are between 3 and 18 K km s−1 by steps of 1.8 K km s−1, and between 12 and 18 K km s−1 by steps of 1.8 K km s−1 for the blue and red contours, respectively. In the white area, no line fitting was attempted because the N2 H + has a S/N <3.
Current usage metrics show cumulative count of Article Views (full-text article views including HTML views, PDF and ePub downloads, according to the available data) and Abstracts Views on Vision4Press platform.
Data correspond to usage on the plateform after 2015. The current usage metrics is available 48-96 hours after online publication and is updated daily on week days.
Initial download of the metrics may take a while.