Fig. 12
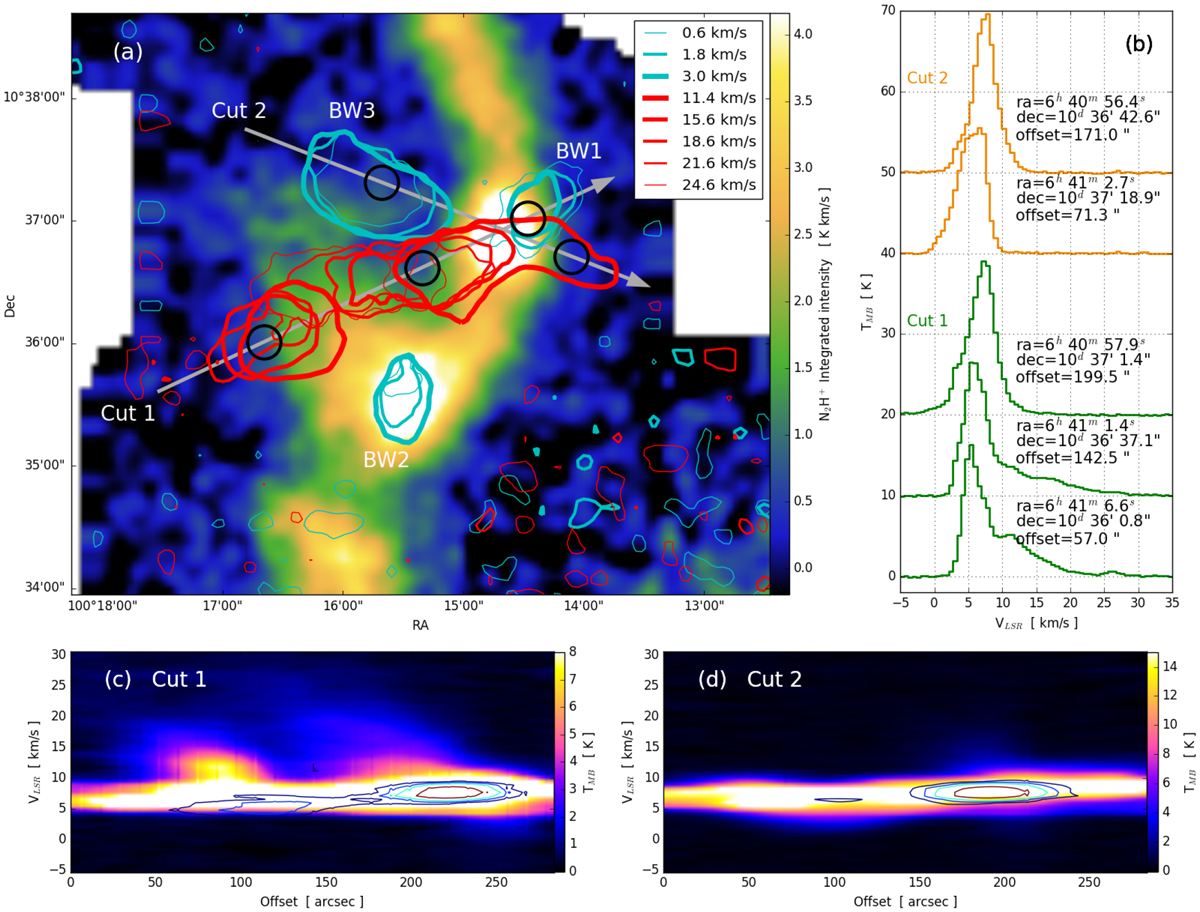
Frame a: Integrated map of N2H+ (in K km s−1) of the junction region. The contours show the emission of 12CO (J = 1–0) at large velocities with respect to the bulk of the cloud. Each contour represent a different velocity as indicated in the inserted legend, and the corresponding levels in Tmb in order of increasing vlsr are 0.5, 1.0, 3.0, 3.0, 1.5, 1.1, 0.8 and 0.6 K. Frame b: Spectra of 12CO (J = 1–0) emission at different locations along the cuts, averaged over the Gaussian beams represented by the black circles in frame a, whose diameters show the beam FWHM (18′′). Frames c–d: Position-velocity diagrams of 12CO emission along the grey arrows shown in frame a, with offset increasing from east to west. The colour scales are cut to emphasise the fainter structures at large velocities. The contours show the emission of the central lines of N2 H + J = 1–0 (unresolved blend of F1F = 21–11, 23–12 and 22–11 lines) at Tmb = 0.15, 0.3, 0.5, 1.0 K.
Current usage metrics show cumulative count of Article Views (full-text article views including HTML views, PDF and ePub downloads, according to the available data) and Abstracts Views on Vision4Press platform.
Data correspond to usage on the plateform after 2015. The current usage metrics is available 48-96 hours after online publication and is updated daily on week days.
Initial download of the metrics may take a while.