Fig. 10
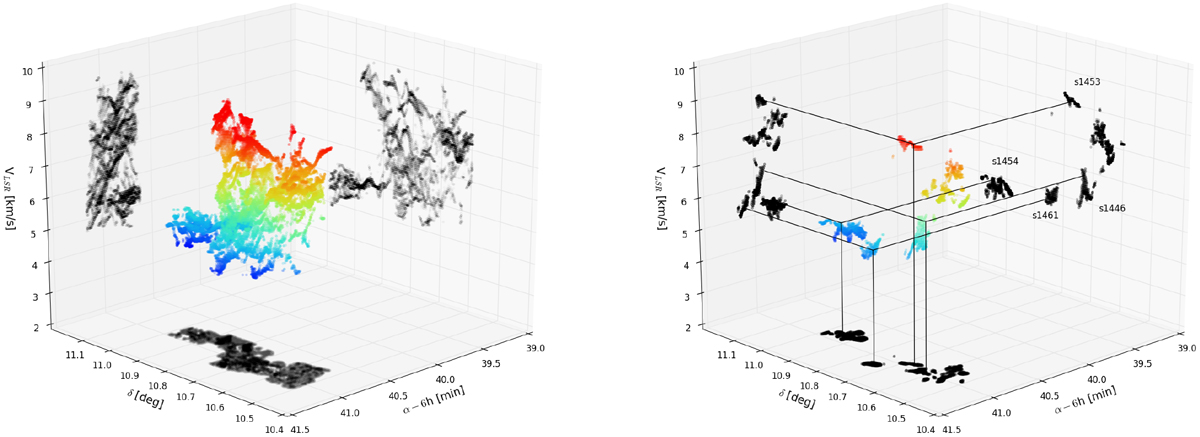
Distribution of line centroids in the position-position-velocity space for 13CO (left) and C18O (right). The colours vary with velocity to help the 3D visualisation. The black points are projections of the colour ones on the faces of the box. In the right frame, lines joining the projections to the colour points are drawn to help visualising in 3D the positions of s1454 (in the north clump), s1461 (at the root of the north-eastern filament), s1446 (in the arc), and s1453 (just north to the arc).
Current usage metrics show cumulative count of Article Views (full-text article views including HTML views, PDF and ePub downloads, according to the available data) and Abstracts Views on Vision4Press platform.
Data correspond to usage on the plateform after 2015. The current usage metrics is available 48-96 hours after online publication and is updated daily on week days.
Initial download of the metrics may take a while.