| Issue |
A&A
Volume 630, October 2019
|
|
|---|---|---|
| Article Number | A131 | |
| Number of page(s) | 9 | |
| Section | Extragalactic astronomy | |
| DOI | https://doi.org/10.1051/0004-6361/201935881 | |
| Published online | 04 October 2019 | |
Relations between phenomenological and physical parameters in the hot coronae of AGNs computed with the MoCA code
1
Dipartimento di Matematica e Fisica, Università degli Studi Roma Tre, Via della Vasca Navale 84, 00146 Roma, Italy
e-mail: riccardo.middei@uniroma3.it
2
ASI – Unità di Ricerca Scientifica, Via del Politecnico snc, 00133 Roma, Italy
3
Univ. Grenoble Alpes, CNRS, IPAG, 38000 Grenoble, France
4
Nicolaus Copernicus Astronomical Center of the Polish Academy of Sciences, ul. Bartycka 18, 00716 Warsaw, Poland
5
INAF/Istituto di Astrofisica e Planetologia Spaziali, Via Fosso del Cavaliere, 00133 Roma, Italy
Received:
13
May
2019
Accepted:
8
August
2019
Context. The primary X-ray emission in active galactic nuclei (AGNs) is widely believed to be due to Comptonisation of the thermal radiation from the accretion disc in a corona of hot electrons. The resulting spectra can, in first approximation, be modelled with a cut-off power law, the photon index and the high-energy roll-over encoding information on the physical properties of the X ray emitting region. The photon index and the high-energy curvature of AGNs (Γ, Ec) have been largely studied since the launch of X-ray satellites operating above 10 keV. However, high-precision measurements of these two observables have only been obtained in recent years thanks to the unprecedented sensitivity of NuSTAR up to 79 keV.
Aims. We aim at deriving relations between Γ, Ec phenomenological parameters and the intrinsic properties of the X-ray-emitting region (the hot corona), namely the optical depth and temperature.
Methods. We use MoCA (Monte Carlo code for Comptonisation in Astrophysics) to produce synthetic spectra for the case of an AGN with MBH = 1.5 × 10⁸ M⊙ and ṁ = 0.1 and then compared them with the widely used power-law model with an exponential high-energy cutoff.
Results. We provide phenomenological relations relating Γ and Ec with the opacity and temperature of the coronal electrons for the case of spherical and slab-like coronae. These relations give origin to a well defined parameter space which fully contains the observed values. Exploiting the increasing number of high-energy cut-offs quoted in the literature, we report on the comparison of physical quantities obtained using MoCA with those estimated using commonly adopted spectral Comptonisation models. Finally, we discuss the negligible impact of different black hole masses and accretion rates on the inferred relations.
Key words: galaxies: active / quasars: general / X-rays: galaxies
© ESO 2019
1. Introduction
X-rays emerging from active galactic nuclei (AGNs) are the result of an inverse-Compton process occurring in the proximity of the central black hole (BH), where optical-UV photons arising from the accretion disc are inverse-Compton scattered by hot electrons in an optically thin, compact corona (e.g. Haardt & Maraschi 1991, 1993; Haardt et al. 1994, for details on the two-phase model). Such a Comptonisation mechanism accounts for the power-law-like shape of the X-ray primary continuum emission and the high-energy roll-over observed in various nearby AGNs (e.g. Nicastro et al. 2000; Perola et al. 2002; De Rosa et al. 2002; Molina et al. 2009, 2013; Malizia et al. 2014; Ricci et al. 2018). Broadband X-ray spectral investigations are of primary importance in studying AGN Comptonisation properties. Indeed, as extensively discussed in the literature (e.g. Ghisellini 2013) both the photon index (Γ) and high-energy cut-off (Ec) of the X-ray primary emission depend on the intrinsic properties of the Comptonising medium, namely its temperature, optical depth, and geometry. Therefore, the interplay between coronal parameters and the AGN X-ray spectral shape has been the object of several investigations, especially with observatories capable of detecting hard X-rays. Dadina (2007), using BeppoSAX data, collected and studied the photon index and Ec of a sample of AGNs (see also Perola et al. 2002, for previous results), while similar works were performed on INTEGRAL data (e.g. Bassani et al. 2006; Molina et al. 2009; Malizia et al. 2014), and, in the context of the BAT AGN Spectroscopic Survey, by Ricci et al. (2018). Subsequently, NuSTAR (Harrison et al. 2013), thanks to its unprecedented effective area above 10 keV, greatly helped in studying the exponential cut-offs of the nuclear continuum in several AGNs (see e.g. Fabian et al. 2015, 2017; Tortosa et al. 2018a). These space missions gave rise to a substantial corpus of high-energy cut-off and photon index measurements.
While several Comptonisation models exist in the literature, many of them also available for direct fitting to the data, they are usually valid in a limited range of parameters. Moreover, in some papers, especially in the past and/or when a large sample of sources were analysed, only the phenomenological parameters are provided. It could therefore be of some help to have relations converting phenomenological parameters to physical ones. Petrucci et al. (2000) provided an approximate relation between the observed high-energy cut-off of NGC 5548 and the thermal energy of the corona (Ec ∼ 2 − 3 kT), while Petrucci et al. (2001) discussed this for a larger sample of Seyfert 1 galaxies observed with BeppoSAX. However, this relation has proven to be accurate only for an extended slab geometry. On the other hand, Beloborodov (1999) reports a relation between the spectral photon index and the Compton parameter y. This parameter is the product of the average fractional energy change per scattering and the mean number of scatters that the photon undergoes. Subsequently, y is used to characterise the energy gain of a photon scattering within a finite medium. The Compton parameter encodes the physical conditions of the coronal plasma, and it can be defined as follows:
where θ = kT/mec2, and τ is the Comptonising medium opacity. Furthermore, Beloborodov (1999) found that the photon index is related to y according to  .
.
In this paper, we derive and discuss formulae which directly relate the phenomenological quantities Γ-Ec with the corresponding coronal properties kT-τ for the cases of a slab-like and spherical corona. These relations were obtained using MoCA (Monte Carlo code for Comptonisation in Astrophysics, Tamborra et al. 2018).
2. MoCA simulations and setup
2.1. Hot corona and accretion disc
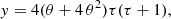
Comptonisation Monte Carlo code (MoCA; see Tamborra et al. 2018 for a detailed description of the code) is based on a single photon approach, working in a fully special relativistic scenario. MoCA allows for various and different physical and geometrical conditions of the accretion disc and of the Comptonising corona. In this paper, the corona is assumed to have either a spherical or a slab-like geometry, and to be as extended as the disc, whose radii have been set to be Rout = 500 rg and Rin = 6 rg, respectively. Even though arguments (e.g. variability, Uttley et al. 2014, and references therein, microlensing Chartas et al. 2009; Morgan et al. 2012 and timing Kara et al. 2016; De Marco et al. 2013) exist that favour a compact corona, we used extended coronae. In fact, as discussed by Marinucci et al. (2019), Comptonised spectra emerging from compact corona (Rout = 100 rg–Rin = 6) do not deviate significantly from those produced in more extended corona; see their Fig. 3. The adoption of even more compact coronae (Rout = 20 rg, Rin = 6) results only in the need for higher optical depths to recover the same spectral shape for a given temperature. However, in such cases, general relativity (GR) effects are not negligible (see Tamborra et al. 2018, for a detailed discussion on this topic), and the present version of MoCA does not include GR. For the slab-like geometry case, MoCA allows the user to set up the corona height above the accretion disc (set to 10 rg in our simulations). We use synthetic spectra computed assuming the source BH mass and accretion rate to be the same as those of Ark 120 (e.g. Marinucci et al. 2019, and references therein), namely MBH = 1.5 × 10⁸ M⊙ and ṁ = Lbol/LEdd = 0.1. For both the slab and spherical hot electron configurations, we simulated the Comptonised spectra using a wide range of values for electron temperature and optical depth: 0.1 < τ < 7 and 20 < kT < 200 keV, and in Fig. 1 we show a sample of spectra obtained by MoCA. Moreover, spectra are computed from 0.01 keV up to 700 keV using 1000 logarithmic energy bins, and a Poissonian error accompanies each spectral point. The obtained spectra are averaged over the inclination angle and in Fig. 1 we show some exemplificative spectra normalised at 1 keV accounting for the two geometries considered in this work.
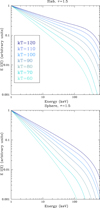 |
Fig. 1. E I(E) graphs of the MoCA simulations normalised at 1 keV. Curves refer to a fixed τ = 1.5 and different electron temperatures. The colour code is the same for the two panels. It is worth noting that the same τ-kT couple gives rise to different spectra when the slab-like or the spherical geometries are considered. |
2.2. Analysis
To find relations between the phenomenological and physical coronal parameters, we fitted the simulated spectra with a power law with an exponential cut-off (model cutoffpl in Xspec, Arnaud 1996). During the fitting procedure, the high-energy cut-off, the normalisation, and the photon index of the primary continuum emission are free to vary. Fits are performed in the 2−700 keV energy interval, or up to the last populated energy bin, if lower than 700 keV. In the fits, the C statistic has been used (Cash 1979). These steps yield a corresponding fitted Γ-Ec pair for each kT-τ couple. At this stage of the analysis, we excluded all the spectra for which we obtained a photon index outside the interval 1.5−2.5. In fact, we have no evidence of AGNs with such a flat or steep photon index (e.g. Bianchi et al. 2009; Sobolewska & Papadakis 2009; Serafinelli et al. 2017). In general, the cut-off power law is a very good approximation of the simulated spectra and in Fig. 2 we show the goodness of the fits (quantified in terms of the C/d.o.f. ratio) as a function of the coronal properties. We notice that this ratio increases towards those regions corresponding to photon indices as flat as ∼1.5 and residuals with respect the cut-off power law mainly occur at high energy; see Fig. 3. These high-energy residuals cannot be observed with current facilities; indeed, they are outside the bandpass of the major operating observatories, and when instruments are sensible to such energetic photons these deviations are not detectable with the available signal-to-noise ratio.
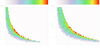 |
Fig. 2. Map of the ratios between the C statistics and the degrees of freedom for the slab-like (left) and spherical (right) cases. The cut-off power law is a good approximation of the simulated spectra. |
 |
Fig. 3. Case of a spectrum with a relatively high C/d.o.f. emerging from a slab corona with τ = 1.4 and kT = 85 keV. The cut-off power law leaves residuals mainly above 100 keV. |
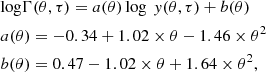
To derive relations connecting Γ-Ec with kT-τ, we started analysing the dependence of the photon index on the Compton parameter y. For each Γ-Ec couple, we then computed the corresponding y using the proper τ-kT. In Fig. 4, we plot the photon index as a function of y for different values of τ and for a fixed kT. We then performed log-log fits between Γ and y. In the fits, both the normalisation and the slope are free to vary. These Γ and the Compton parameter y are clearly correlated, although points are widely dispersed; see Fig 4. On the other hand, we found that such a widespread dispersion is due to a further dependence of Γ on the coronal temperature, which we quantified studying how the slopes (a) and normalisations (b) of the fits behave as a function of kT. We then performed additional fits between the following parameters: a − kT and b − kT. This procedure leads to Eq. (2) for the case of a slab-like corona:
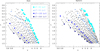 |
Fig. 4. Photon index as a function of the Compton parameter. The y parameter is computed for the various optical depths and for all the temperatures (kept fixed). The colour code is the same for both panels. |
where  . For the spherical case we obtain
In accordance with these formulae, the photon index does not depend only on y, but is rather a function of kT and y. To estimate the associated mean uncertainty ΔΓ/Γ for Eqs. (2) and (3) we compared the inferred photon indices with values obtained fitting the simulations. The average of all the percentage errors yields a ΔΓ/Γ of ∼1.5%(1%) for the case of a slab-like (spherical) hot-corona. For the case of spherical geometry, we compared our Eq. (3) with the relation by Beloborodov (1999):  . The author computed his equation by studying spectra simulated with the code by Coppi & Zdziarski (1992) for only two values of kT (50 and 100 keV) and leaving the electron opacity free to vary. To estimate its uncertainty, we calculated the expected photon index using the relation by Beloborodov (1999) for all the kT-τ couples. The comparison of these estimates with the fitted Γ leads to an average percentage uncertainty of ΔΓ/Γ = 14%, showing that this simplified formula significantly deviates from the MoCA predictions.
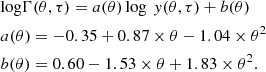
In a similar fashion, we derived relations connecting the high-energy cut-off with the physical properties of the Comptonising plasma. The high-energy roll-over is mainly dependent on the coronal temperature. Thus, we started studying the Ec as a function of kT keeping τ fixed; see Fig. 5. The dependence of Ec on the plasma temperature is estimated by performing log-log fits between this parameter and kT for different values of τ. On the other hand, the obtained slopes (α) and normalisations (β) are found to depend on the coronal opacity. Therefore, we quantified this dependence on the optical depth by performing linear fits for α and β as a function of τ. For the case of a slab-like corona these steps yield the following relations:
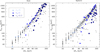 |
Fig. 5. High-energy cut-off as a function of the electron temperature, for a fixed optical depth. Colours are the same in both graphs. |
For a spherical geometry we obtain
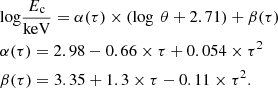
The uncertainty associated with Eq. (4) is ΔEc/Ec ≃ 13%, while for the case of a spherical corona we obtain ΔEc/Ec ≃ 17%. For both geometries considered here, the high-energy cut-off not only depends on the electron temperature, but also on the coronal opacity. The above equations directly relate the high-energy cut-off with the coronal temperature and encode the dependence on opacity of the Comptonising electrons.
Once the dependence between the phenomenological parameters and the physical kT and τ have been quantified, we use Eqs. (2) and (4) for the slab-like coronae and Eqs. (3) and (5) for the spherical coronae to determine the interesting regions in the kT-τ parameters space. In particular, by plotting iso-Γ curves for 1.5 ≤ Γ ≤ 2.5 and iso-Ec lines, we identify regions in the physical parameters plane corresponding to typically measured AGN photon indices and high-energy cut-offs; see Fig. 6. On average, for a certain Γ, a slab corona returns lower values of optical depth and temperature, while to reach the same spectral shape, higher kT and τ are required when a sphere-like corona is considered. Moreover, iso-Ec curves behave differently for the two geometries. Indeed for the sphere, high-energy cut-offs generally correspond to higher temperatures (≳10 keV more) if compared with those measured assuming a slab corona. Furthermore, we observe that the commonly adopted relation Ec ∼ 2 − 3 kT is not valid for all the kT and τ regimes; see Fig. 7.
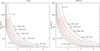 |
Fig. 6. Grids in the physical parameters space computed using Eqs. (2)–(5). Black solid lines represent the iso-Γ curves, while iso-Ec are shown via the red solid-dashed lines. Iso-Γ curves have a 0.2 step and Γ steepens from right to left. A 50 keV step is used to represent the various high-energy cut-off iso-curves. |
 |
Fig. 7. Ratio between the high-energy cut-off Ec and the coronal temperature kT displayed as a function of the optical depth τ for both geometries. In both panels, straight solid lines represent the best-fit between Ec/kT and τ at a fixed temperature kT, while lines connecting the points are reported for plot purposes only. |
In this figure, we show the high-energy cut-off and electron temperature ratio as a function of the coronal opacity. In particular, we point out that for low-temperature regimes the optical depth does not play any role in determining the cut-off energy of the spectrum, while at larger electron temperatures, the Ec/kT ratio is no more insensitive to the coronal opacity.
Since a dependence of the Comptonised spectra on the spectral shape of the seed photons would affect our conversions and the derived coronal parameters, here we check if Eqs. (2)–(5) can be broadly used regardless of the AGN black hole mass and accretion rate. We computed simulations for MBH = 107 M⊙ and ṁ = 0.1, MBH = 108 M⊙ with ṁ = 0.05 and ṁ = 0.2, and, finally, for MBH = 109 M⊙ and ṁ = 0.1. Following the same procedure described in Sect. 3, we fitted these spectra using a cut-off power-law model within Xspec. As in the previous case, this allowed us to build a new database of correspondences between the phenomenological and physical parameters. Neither the photon index nor the high-energy cut-off estimates are strongly dependent on the particular values of black hole masses and accretion rate. In fact, we notice that the fitted values for the phenomenological parameters are within the uncertainties associated to the equations reported in this section.
3. Estimates of coronal parameters in local AGNs
3.1. The NuSTAR sample
Our relations can be used for probing the coronal properties of AGNs. From Eqs. (2)–(5), we can directly obtain the coronal properties of those Seyfert galaxies for which Ec and Γ are available. Here, we consider the AGN sample presented by Tortosa et al. (2018a), which we updated to include recently observed AGNs. Moreover, when multiple values are found in the literature for the same source, Γ and Ec measurements based on broadband analyses have been preferred. The use of our formulae on the chosen phenomenological parameters Γ and Ec yielded Table 1, in which we report the MoCA-based estimates for the coronal optical depth and temperature.
MoCA estimates for various AGNs observed by NuSTAR characterised by NH < 6 × 1022 cm−2.
As expected, the optical depths for the slab-like coronae are systematically smaller than those derived assuming a spherical corona (see Table 1, Figs. 1 and 6). This is due to the fact that in the spherical corona the optical depth τ is the radial one, and is therefore the same in all directions, while for the slab-case τ is the vertical and therefore minimal value. Adopting the equations derived in Sect. 2, we compute contour plots of the sources listed in Table 1; see Fig. 8. When the source high-energy cut-off is well determined, the corresponding contour in the physical parameter space is closed (see purple contours in Fig. 8), otherwise the corresponding curves are not limited at high kT (lavender in Fig. 8). The average values for the coronal opacity and temperature are τ = 1.9 ± 0.8, kT = 50 ± 21 keV and τ = 3.1 ± 1.3, kT = 53 ± 23 keV for the slab-like and the spherical geometries, respectively. We obtain a larger τ and a smaller kT than the ones presented in Ricci et al. (2018), for a slab-like geometry; likely because they included upper limits on the optical depth and lower limits of high-energy cut-off. Moreover, these latter authors computed kT to be Ec/2, thus overestimating the electron temperature, especially at low opacity; see Fig. 7.
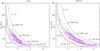 |
Fig. 8. Contours in the physical parameter space for all the AGNs reported in Table 1. Magenta contours correspond to measured high-energy cut-off while blue is used for AGNs characterised by an unconstrained high-energy cut-off. Moreover, black and red curves emphasise the iso-Γ and iso-Ec labelled in the plot. |
3.2. Comparison with different comptonisation codes
As a further step, we compared our estimates with those in literature. In particular, in Fig. 9, we compare the MoCA-based estimates with those reported by other authors and resulting from spectroscopic analyses based on various Comptonisation codes (i.e. compTT Titarchuk 1994, nthcomp Zdziarski et al. 1996, and compPS Poutanen & Svensson 1996). MoCA-measurements of the slab-like coronal opacity appear to be larger, on average, than τ obtained with other models (see top left panel of Fig. 9), while no trend is found between MoCA and literature values of the electron temperature. For the spherical case, MoCA estimates of the coronal opacity and electron temperature, except for a few exceptions (e.g. NGC 5506), are compatible with measurements from compTT, nthcomp, and compPS.
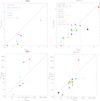 |
Fig. 9. Comparison of estimates of kT and τ obtained with MoCA and using different models: nthcomp (triangles), compTT (circles), and compPS (squares); see Tortosa et al. (2018a) and references therein. The 1:1 relation to the graph is also shown. The top and bottom left panels are computed for a slab-like corona, while the remaining panels account for the spherical case. Different coloured names correspond to the various sources that are the same between top and bottom left panels and top and bottom right panels. Temperature and optical depth literature values for the sources are reported by Tortosa et al. (2018a), with the exception of NGC 7469 and HE 0436−4714 for which kT and τ are reported by Middei et al. (2018a,b), respectively. |
4. Summary and conclusion
This paper reports on the first systematic application of the code MoCA (Tamborra et al. 2018) to study the high-energy emission of AGNs. MoCA allowed us to simulate X-ray spectra assuming a wide range of parameters describing the AGNs (MBH, ṁ) as well as the Comptonising medium, such as geometry, temperature, and optical depth. The main results can be summarised as follows:
-
We derived relations between phenomenological (Γ and Ec) and physical (electron temperature and optical depth) coronal parameters, assuming either a spherical corona or a slab-like one. We find that Γ depends on the Compton parameter y, and also on kT. The Ec is a function of the coronal temperature and the optical depth; see Eqs. (2)–(5), and Fig. 7. Moreover, the relation Ec = 2−3 kT is found to be valid only for a limited range of physical parameters, especially for low τ and kT; see Fig. 7.
-
The derived equations allowed us to determine the loci occupied by the observed AGNs in the physical space of the electron temperature and optical depth (see Fig. 6), resulting in a plot useful for deriving the AGN coronal properties from the measured Γ and Ec. We then applied the results to an upgraded version of the AGN sample of Tortosa et al. (2018a). We found the impact of the seed photon field spectral shape on the emerging Comptonised spectrum to be weak. The Γ-Ec measurements obtained for different black hole masses and accretion rates are consistent within the dispersion with those estimated using Eqs. (2)–(5).
Acknowledgments
We thank the referee for her/his comments. RM acknowledges Fausto Vagnetti for his precious informatic support, Fondazione Angelo Della Riccia for financial support, Université Grenoble Alpes and the high energy SHERPAS group for welcoming him at IPAG. Pop acknowledges financial support by the CNES and the Programme National High Energies (PNHE) of CNRS/INSU with INP and IN2P3, co-funded by CEA and CNES. FT acknowledges financial support by CAMK and the project “Modelling the X-ray spectral-timing properties of accreting BH systems with realistic Comptonisation models” (PI: Barbara De Marco).
References
- Arnaud, K. A. 1996, in Astronomical Data Analysis Software and Systems V, eds. G. H. Jacoby, & J. Barnes, ASP Conf. Ser., 101, 17 [NASA ADS] [Google Scholar]
- Ballantyne, D. R., Bollenbacher, J. M., Brenneman, L. W., et al. 2014, ApJ, 794, 62 [NASA ADS] [CrossRef] [Google Scholar]
- Baloković, M., Matt, G., Harrison, F. A., et al. 2015, ApJ, 800, 62 [NASA ADS] [CrossRef] [Google Scholar]
- Bassani, L., Molina, M., Malizia, A., et al. 2006, ApJ, 636, L65 [NASA ADS] [CrossRef] [Google Scholar]
- Beloborodov, A. M. 1999, in High Energy Processes in Accreting Black Holes, eds. J. Poutanen, & R. Svensson, ASP Conf. Ser., 161, 295 [NASA ADS] [Google Scholar]
- Bianchi, S., Guainazzi, M., Matt, G., Fonseca Bonilla, N., & Ponti, G. 2009, A&A, 495, 421 [NASA ADS] [CrossRef] [EDP Sciences] [Google Scholar]
- Brenneman, L. W., Madejski, G., Fuerst, F., et al. 2014, ApJ, 788, 61 [NASA ADS] [CrossRef] [Google Scholar]
- Buisson, D. J. K., Parker, M. L., Kara, E., et al. 2018, MNRAS, 480, 3689 [NASA ADS] [CrossRef] [Google Scholar]
- Cash, W. 1979, ApJ, 228, 939 [NASA ADS] [CrossRef] [Google Scholar]
- Chartas, G., Kochanek, C. S., Dai, X., Poindexter, S., & Garmire, G. 2009, ApJ, 693, 174 [NASA ADS] [CrossRef] [Google Scholar]
- Coppi, P. S., & Zdziarski, A. A. 1992, ApJ, 398, L37 [NASA ADS] [CrossRef] [Google Scholar]
- Dadina, M. 2007, A&A, 461, 1209 [NASA ADS] [CrossRef] [EDP Sciences] [Google Scholar]
- De Marco, B., Ponti, G., Cappi, M., et al. 2013, MNRAS, 431, 2441 [NASA ADS] [CrossRef] [Google Scholar]
- De Rosa, A., Fabian, A. C., & Piro, L. 2002, MNRAS, 334, L21 [NASA ADS] [CrossRef] [Google Scholar]
- Fabian, A. C., Lohfink, A., Kara, E., et al. 2015, MNRAS, 451, 4375 [NASA ADS] [CrossRef] [Google Scholar]
- Fabian, A. C., Lohfink, A., Belmont, R., Malzac, J., & Coppi, P. 2017, MNRAS, 467, 2566 [NASA ADS] [CrossRef] [Google Scholar]
- Ghisellini, G. 2013, in Radiative Processes in High Energy Astrophysics (Berlin: Springer Verlag), Lect. Notes Phys., 873 [Google Scholar]
- Haardt, F., & Maraschi, L. 1991, ApJ, 380, L51 [NASA ADS] [CrossRef] [Google Scholar]
- Haardt, F., & Maraschi, L. 1993, ApJ, 413, 507 [NASA ADS] [CrossRef] [MathSciNet] [Google Scholar]
- Haardt, F., Maraschi, L., & Ghisellini, G. 1994, ApJ, 432, L95 [NASA ADS] [CrossRef] [Google Scholar]
- Harrison, F. A., Craig, W. W., Christensen, F. E., et al. 2013, ApJ, 770, 103 [NASA ADS] [CrossRef] [Google Scholar]
- Kara, E., Alston, W., & Fabian, A. 2016, Astron. Nachr., 337, 473 [NASA ADS] [CrossRef] [Google Scholar]
- Kara, E., García, J. A., Lohfink, A., et al. 2017, MNRAS, 468, 3489 [NASA ADS] [CrossRef] [EDP Sciences] [Google Scholar]
- Lanzuisi, G., Perna, M., Comastri, A., et al. 2016, A&A, 590, A77 [NASA ADS] [CrossRef] [EDP Sciences] [Google Scholar]
- Lanzuisi, G., Gilli, R., Cappi, M., et al. 2019, ApJ, 875, L20 [NASA ADS] [CrossRef] [Google Scholar]
- Lohfink, A. M., Ogle, P., Tombesi, F., et al. 2015, ApJ, 814, 24 [NASA ADS] [CrossRef] [Google Scholar]
- Lohfink, A. M., Reynolds, C. S., Pinto, C., et al. 2016, ApJ, 821, 11 [NASA ADS] [CrossRef] [Google Scholar]
- Malizia, A., Molina, M., Bassani, L., et al. 2014, ApJ, 782, L25 [NASA ADS] [CrossRef] [Google Scholar]
- Marinucci, A., Matt, G., Kara, E., et al. 2014a, MNRAS, 440, 2347 [NASA ADS] [CrossRef] [Google Scholar]
- Marinucci, A., Matt, G., Miniutti, G., et al. 2014b, ApJ, 787, 83 [NASA ADS] [CrossRef] [Google Scholar]
- Marinucci, A., Matt, G., Bianchi, S., et al. 2015, MNRAS, 447, 160 [NASA ADS] [CrossRef] [Google Scholar]
- Marinucci, A., Bianchi, S., Braito, V., et al. 2018, MNRAS, 478, 5638 [NASA ADS] [CrossRef] [Google Scholar]
- Marinucci, A., Porquet, D., Tamborra, F., et al. 2019, A&A, 623, A12 [NASA ADS] [CrossRef] [EDP Sciences] [Google Scholar]
- Matt, G., Baloković, M., Marinucci, A., et al. 2015, MNRAS, 447, 3029 [NASA ADS] [CrossRef] [Google Scholar]
- Middei, R., Bianchi, S., Cappi, M., et al. 2018a, A&A, 615, A163 [NASA ADS] [CrossRef] [EDP Sciences] [Google Scholar]
- Middei, R., Vagnetti, F., Tombesi, F., et al. 2018b, A&A, 618, A167 [NASA ADS] [CrossRef] [EDP Sciences] [Google Scholar]
- Molina, M., Bassani, L., Malizia, A., et al. 2009, MNRAS, 399, 1293 [NASA ADS] [CrossRef] [Google Scholar]
- Molina, M., Bassani, L., Malizia, A., et al. 2013, MNRAS, 433, 1687 [NASA ADS] [CrossRef] [Google Scholar]
- Morgan, C. W., Hainline, L. J., Chen, B., et al. 2012, ApJ, 756, 52 [NASA ADS] [CrossRef] [Google Scholar]
- Nicastro, F., Piro, L., De Rosa, A., et al. 2000, ApJ, 536, 718 [NASA ADS] [CrossRef] [Google Scholar]
- Parker, M. L., Wilkins, D. R., Fabian, A. C., et al. 2014, MNRAS, 443, 1723 [NASA ADS] [CrossRef] [Google Scholar]
- Perola, G. C., Matt, G., Cappi, M., et al. 2002, A&A, 389, 802 [NASA ADS] [CrossRef] [EDP Sciences] [Google Scholar]
- Petrucci, P. O., Haardt, F., Maraschi, L., et al. 2000, ApJ, 540, 131 [NASA ADS] [CrossRef] [Google Scholar]
- Petrucci, P. O., Haardt, F., Maraschi, L., et al. 2001, ApJ, 556, 716 [NASA ADS] [CrossRef] [Google Scholar]
- Porquet, D., Reeves, J. N., Matt, G., et al. 2018, A&A, 609, A42 [NASA ADS] [CrossRef] [EDP Sciences] [Google Scholar]
- Poutanen, J., & Svensson, R. 1996, ApJ, 470, 249 [NASA ADS] [CrossRef] [Google Scholar]
- Rani, P., Stalin, C. S., & Goswami, K. D. 2019, MNRAS, 484, 5113 [NASA ADS] [CrossRef] [Google Scholar]
- Ricci, C., Ho, L. C., Fabian, A. C., et al. 2018, MNRAS, 480, 1819 [NASA ADS] [CrossRef] [Google Scholar]
- Risaliti, G., Nardini, E., Salvati, M., et al. 2011, MNRAS, 410, 1027 [NASA ADS] [CrossRef] [Google Scholar]
- Serafinelli, R., Vagnetti, F., & Middei, R. 2017, A&A, 600, A101 [NASA ADS] [CrossRef] [EDP Sciences] [Google Scholar]
- Sobolewska, M. A., & Papadakis, I. E. 2009, MNRAS, 399, 1597 [NASA ADS] [CrossRef] [Google Scholar]
- Tamborra, F., Matt, G., Bianchi, S., & Dovčiak, M. 2018, A&A, 619, A105 [NASA ADS] [CrossRef] [EDP Sciences] [Google Scholar]
- Titarchuk, L. 1994, ApJ, 434, 570 [NASA ADS] [CrossRef] [Google Scholar]
- Tortosa, A., Marinucci, A., Matt, G., et al. 2017, MNRAS, 466, 4193 [NASA ADS] [Google Scholar]
- Tortosa, A., Bianchi, S., Marinucci, A., Matt, G., & Petrucci, P. O. 2018a, A&A, 614, A37 [NASA ADS] [CrossRef] [EDP Sciences] [Google Scholar]
- Tortosa, A., Bianchi, S., Marinucci, A., et al. 2018b, MNRAS, 473, 3104 [NASA ADS] [CrossRef] [MathSciNet] [Google Scholar]
- Ursini, F., Boissay, R., Petrucci, P.-O., et al. 2015, A&A, 577, A38 [NASA ADS] [CrossRef] [EDP Sciences] [Google Scholar]
- Ursini, F., Petrucci, P.-O., Matt, G., et al. 2016, MNRAS, 463, 382 [NASA ADS] [CrossRef] [Google Scholar]
- Uttley, P., Cackett, E. M., Fabian, A. C., Kara, E., & Wilkins, D. R. 2014, A&ARv, 22, 72 [NASA ADS] [CrossRef] [EDP Sciences] [Google Scholar]
- Younes, G., Ptak, A., Ho, L. C., et al. 2019, ApJ, 870, 73 [NASA ADS] [CrossRef] [Google Scholar]
- Young, A. J., McHardy, I., Emmanoulopoulos, D., & Connolly, S. 2018, MNRAS, 476, 5698 [NASA ADS] [CrossRef] [Google Scholar]
- Zdziarski, A. A., Johnson, W. N., & Magdziarz, P. 1996, MNRAS, 283, 193 [NASA ADS] [CrossRef] [Google Scholar]
All Tables
MoCA estimates for various AGNs observed by NuSTAR characterised by NH < 6 × 1022 cm−2.
All Figures
|
Fig. 1. E I(E) graphs of the MoCA simulations normalised at 1 keV. Curves refer to a fixed τ = 1.5 and different electron temperatures. The colour code is the same for the two panels. It is worth noting that the same τ-kT couple gives rise to different spectra when the slab-like or the spherical geometries are considered. |
| In the text | |
|
Fig. 2. Map of the ratios between the C statistics and the degrees of freedom for the slab-like (left) and spherical (right) cases. The cut-off power law is a good approximation of the simulated spectra. |
| In the text | |
|
Fig. 3. Case of a spectrum with a relatively high C/d.o.f. emerging from a slab corona with τ = 1.4 and kT = 85 keV. The cut-off power law leaves residuals mainly above 100 keV. |
| In the text | |
|
Fig. 4. Photon index as a function of the Compton parameter. The y parameter is computed for the various optical depths and for all the temperatures (kept fixed). The colour code is the same for both panels. |
| In the text | |
|
Fig. 5. High-energy cut-off as a function of the electron temperature, for a fixed optical depth. Colours are the same in both graphs. |
| In the text | |
|
Fig. 6. Grids in the physical parameters space computed using Eqs. (2)–(5). Black solid lines represent the iso-Γ curves, while iso-Ec are shown via the red solid-dashed lines. Iso-Γ curves have a 0.2 step and Γ steepens from right to left. A 50 keV step is used to represent the various high-energy cut-off iso-curves. |
| In the text | |
|
Fig. 7. Ratio between the high-energy cut-off Ec and the coronal temperature kT displayed as a function of the optical depth τ for both geometries. In both panels, straight solid lines represent the best-fit between Ec/kT and τ at a fixed temperature kT, while lines connecting the points are reported for plot purposes only. |
| In the text | |
|
Fig. 8. Contours in the physical parameter space for all the AGNs reported in Table 1. Magenta contours correspond to measured high-energy cut-off while blue is used for AGNs characterised by an unconstrained high-energy cut-off. Moreover, black and red curves emphasise the iso-Γ and iso-Ec labelled in the plot. |
| In the text | |
|
Fig. 9. Comparison of estimates of kT and τ obtained with MoCA and using different models: nthcomp (triangles), compTT (circles), and compPS (squares); see Tortosa et al. (2018a) and references therein. The 1:1 relation to the graph is also shown. The top and bottom left panels are computed for a slab-like corona, while the remaining panels account for the spherical case. Different coloured names correspond to the various sources that are the same between top and bottom left panels and top and bottom right panels. Temperature and optical depth literature values for the sources are reported by Tortosa et al. (2018a), with the exception of NGC 7469 and HE 0436−4714 for which kT and τ are reported by Middei et al. (2018a,b), respectively. |
| In the text | |
Current usage metrics show cumulative count of Article Views (full-text article views including HTML views, PDF and ePub downloads, according to the available data) and Abstracts Views on Vision4Press platform.
Data correspond to usage on the plateform after 2015. The current usage metrics is available 48-96 hours after online publication and is updated daily on week days.
Initial download of the metrics may take a while.