Fig. 9.
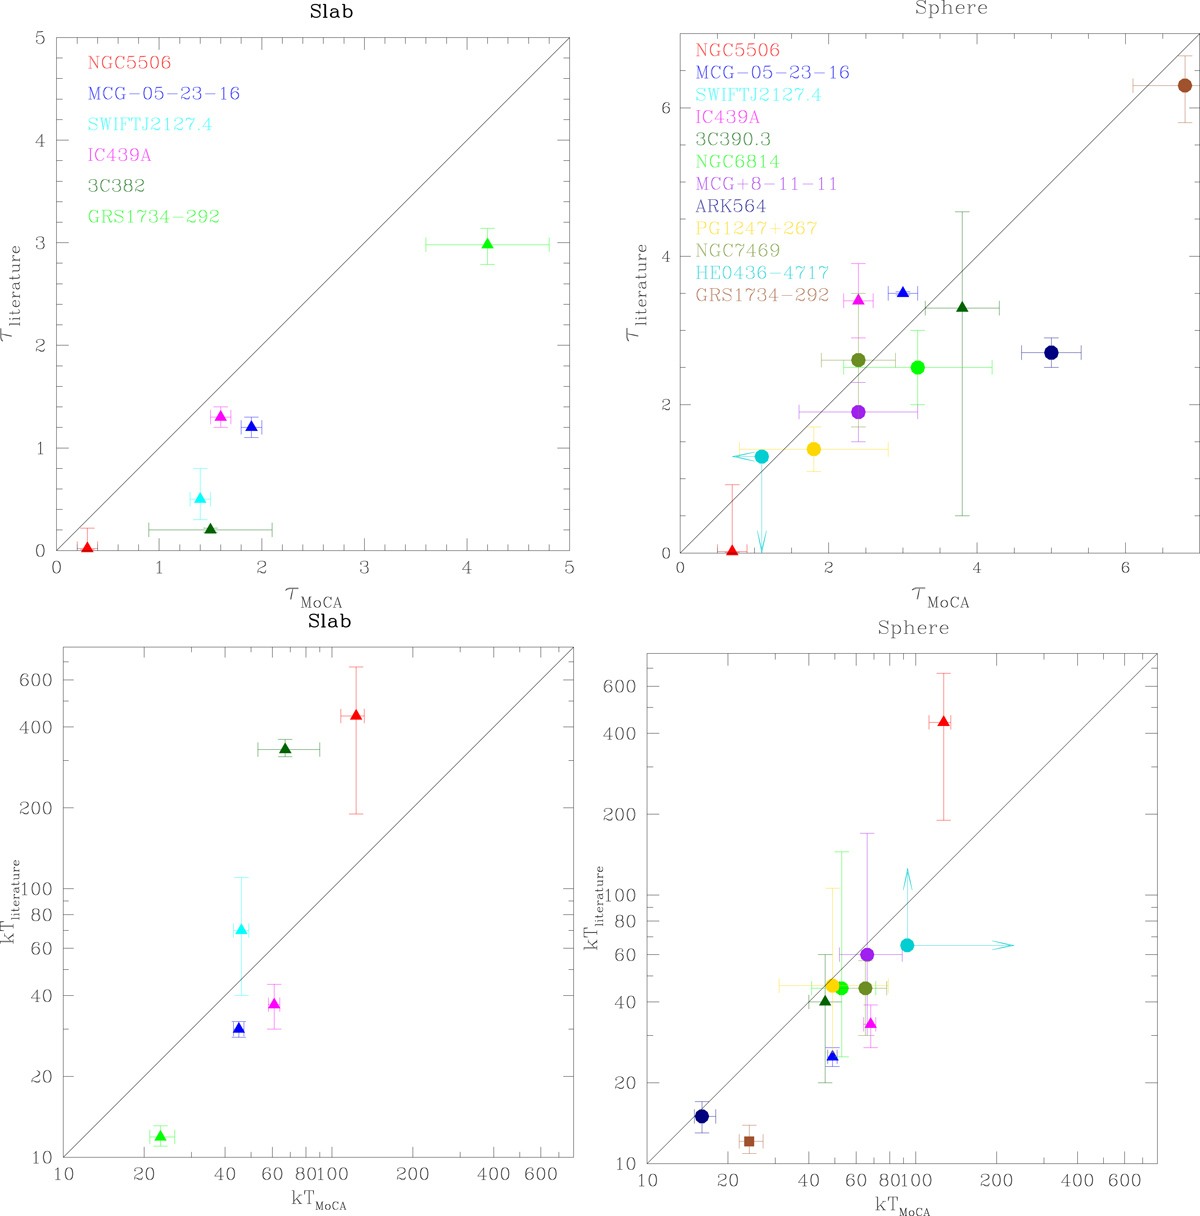
Comparison of estimates of kT and τ obtained with MoCA and using different models: nthcomp (triangles), compTT (circles), and compPS (squares); see Tortosa et al. (2018a) and references therein. The 1:1 relation to the graph is also shown. The top and bottom left panels are computed for a slab-like corona, while the remaining panels account for the spherical case. Different coloured names correspond to the various sources that are the same between top and bottom left panels and top and bottom right panels. Temperature and optical depth literature values for the sources are reported by Tortosa et al. (2018a), with the exception of NGC 7469 and HE 0436−4714 for which kT and τ are reported by Middei et al. (2018a,b), respectively.
Current usage metrics show cumulative count of Article Views (full-text article views including HTML views, PDF and ePub downloads, according to the available data) and Abstracts Views on Vision4Press platform.
Data correspond to usage on the plateform after 2015. The current usage metrics is available 48-96 hours after online publication and is updated daily on week days.
Initial download of the metrics may take a while.