Free Access
Fig. 8.
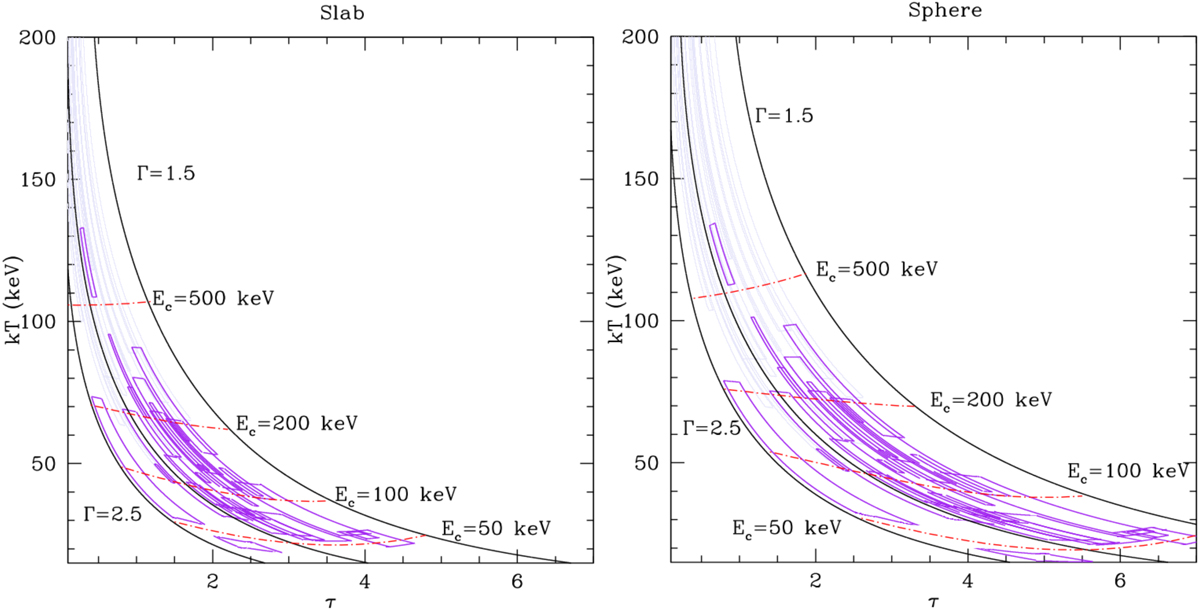
Contours in the physical parameter space for all the AGNs reported in Table 1. Magenta contours correspond to measured high-energy cut-off while blue is used for AGNs characterised by an unconstrained high-energy cut-off. Moreover, black and red curves emphasise the iso-Γ and iso-Ec labelled in the plot.
Current usage metrics show cumulative count of Article Views (full-text article views including HTML views, PDF and ePub downloads, according to the available data) and Abstracts Views on Vision4Press platform.
Data correspond to usage on the plateform after 2015. The current usage metrics is available 48-96 hours after online publication and is updated daily on week days.
Initial download of the metrics may take a while.