| Issue |
A&A
Volume 629, September 2019
|
|
|---|---|---|
| Article Number | A114 | |
| Number of page(s) | 16 | |
| Section | Catalogs and data | |
| DOI | https://doi.org/10.1051/0004-6361/201935987 | |
| Published online | 12 September 2019 | |
Stars and brown dwarfs in the σ Orionis cluster
IV. IDS/INT and OSIRIS/GTC spectroscopy and Gaia DR2 astrometry⋆
1
Centro de Astrobiología (CSIC-INTA), ESAC, camino bajo del castillo s/n, 28691 Villanueva de la Cañada, Madrid, Spain
e-mail: This email address is being protected from spambots. You need JavaScript enabled to view it.
2
Isaac Newton Group of Telescopes, apartado de correos 321, 38700 Santa Cruz de La Palma, La Palma, Spain
3
Leiden Observatory, Leiden University, PO Box 9513 2300 Leiden, The Netherlands
4
Departamento de Física de la Tierra y Astrofísica & IPARCOS-UCM (Instituto de Física de Partículas y del Cosmos de la UCM), Facultad de Ciencias Físicas, Universidad Complutense de Madrid, 28040 Madrid, Spain
5
Instituto de Astrofísica de Canarias, Avenida Vía Láctea, 38205 La Laguna, Tenerife, Spain
6
Grantecan S. A., Centro de Astrofísica de La Palma, Cuesta de San José, 38712 Breña Baja, La Palma, Spain
7
Departamento de Astrofísica, Universidad de La Laguna, 38205 La Laguna, Tenerife, Spain
Received:
30
May
2019
Accepted:
7
August
2019
Abstract
Context. Only a few open clusters are as important for the study of stellar and substellar objects, and their formation and evolution, as the young σ Orionis cluster. However, a complete spectroscopic characterisation of its whole stellar population is still missing.
Aims. We filled most of that gap with a large spectroscopic and astrometric survey of targets towards σ Orionis. Eventually, it will be one of the open clusters with the lowest proportion of interlopers and the largest proportion of confirmed cluster members with known uncontrovertible youth features.
Methods. We acquired 317 low-resolution optical spectra with the Intermediate Dispersion Spectrograph (IDS) at the 2.5 m Isaac Newton Telescope (INT) and the Optical System for Imaging and low Resolution Integrated Spectroscopy (OSIRIS) at the 10.4 m Gran Telescopio Canarias (GTC). We measured equivalent widths of Li I, Hα, and other key lines from these spectra, and determined spectral types. We complemented this information with Gaia DR2 astrometric data and other features of youth (mid-infrared excess, X-ray emission) compiled with Virtual Observatory tools and from the literature.
Results. Of the 168 observed targets, we determined for the first time spectral types of 39 stars and equivalent widths of Li I and Hα of 34 and 12 stars, respectively. We identified 11 close (ρ ≲ 3 arcsec) binaries resolved by Gaia, of which three are new, 14 strong accretors, of which four are new and another four have Hα emission shifted by over 120 km s−1, two juvenile star candidates in the sparse population of the Ori OB1b association, and one spectroscopic binary candidate. Remarkably, we found 51 non-cluster-members, 35 of which were previously considered as σ Orionis members and taken into account in high-impact works on, for example, disc frequency and initial mass function.
Key words: open clusters and associations: individual: σ Orionis / stars: early-type / stars: solar-type / stars: late-type / stars: emission-line / Be / stars: pre-main sequence
Full Tables A.1–A.5 are only available at the CDS via anonymous ftp to cdsarc.u-strasbg.fr (130.79.128.5) or via http://cdsarc.u-strasbg.fr/viz-bin/cat/J/A+A/629/A114
© ESO 2019
1. Introduction
There are a few nearby young clusters, such as the Pleaides and the Hyades, whose stellar (and substellar) populations have been investigated in detail for decades, which translates into hundreds of known Pleiads and Hyads (Johnson & Mitchell 1958; Herbig 1962; Chaffee et al. 1971; Vandenberg & Bridges 1984; Boesgaard & Tripicco 1986; Soderblom et al. 1993; Perryman et al. 1998; Stauffer et al. 1998; Bouvier et al. 2018; Martín et al. 2018, to cite just a few examples). As a result, these clusters are cornerstones for the study of the formation and evolution of stars.
The very young σ Orionis open cluster (τ ∼ 3 Ma, d ∼ 388 pc), near the Horsehead nebula in the Ori OB1b association, is one of the most attractive and most visited regions for night-sky observers, both professional and amateur. This cluster was discovered by Garrison (1967), re-discovered by Wolk (1996), introduced to a new era by Béjar et al. (1999) and Zapatero Osorio et al. (2000), and finally reviewed by Walter et al. (2008) and Caballero (2008a). At that stage, σ Orionis became one of the best-studied young open clusters together with the Pleiades and the Hyades, and at the same level of importance as other very young open clusters and star-forming regions, such as the Trapezium, Taurus-Auriga, or ρ Ophiuchi, which are affected by (spatially variable) extinction. A major event in the history of σ Orionis studies was the computation of a continuous mass function from about 20 M⊙ to only about 0.005 M⊙ by Peña Ramírez et al. (2012). For that, these latter authors complemented their very deep VISTA survey with the Mayrit catalogue of σ Orionis stars and brown dwarfs (Caballero 2008a), which remains the most comprehensive database of cluster members. This catalogue was the first item of the paper series “Stars and brown dwarfs in the σ Orionis cluster”, which was continued by Caballero (2010a), who conducted a pre-Gaia proper-motion analysis, and by Caballero et al. (2012), who reviewed the most relevant publications on the cluster between 2008 and 2012, published a number of low-resolution optical spectra of member stars and brown dwarfs that lacked previous spectroscopy, and updated the Mayrit catalogue. However, the results presented by Caballero et al. (2012) were superseded by the spectroscopic census of Hernández et al. (2014), which constitutes the largest homogeneous spectroscopic data set of the σ Orionis cluster to date.
In the last lustrum, the Mayrit catalogue has been used for searching for pulsations and photometric variability in substellar objects (Cody & Hillenbrand 2014; Elliott et al. 2017), extending spectroscopic surveys to the lowest masses and the largest separations to the cluster centre (Koenig et al. 2015; Zapatero Osorio et al. 2017; Cottle et al. 2018), characterising discs with theoretical models and ALMA and Spitzer observations (Álvarez-Meraz et al. 2017; Ansdell et al. 2017; Winter et al. 2018; Pérez-Blanco et al. 2018), identifying large-scale Herbig-Haro jets driven by proto-brown dwarfs (Riaz et al. 2017, 2019), and carefully analysing the massive multiple stellar system that gives the name to the cluster (Simón-Díaz et al. 2015; Schaefer et al. 2016), not counting the studies performed by the first author and his colleagues on multiplicity (Caballero 2014; Caballero et al. 2016, 2018) and parallaxes and proper motions (Caballero 2017, 2018).
In spite of all these studies, there are still a number of photometric cluster member candidates in both stellar and substellar regimes that lack membership confirmation. Furthermore, beyond the cluster core and at angular separations greater than 20 arcmin from the cluster centre at the eponymous σ Ori Trapezium-like system (Caballero 2008b), the contamination by distinct populations of young stars in the Ori OB1b association continues to increase. Neighbouring populations have been reported towards the younger Horsehead and Flame nebulae to the east and the older ϵ Orionis cluster to the north and west, but there are also hints of a sparse population of 5–30 Ma-old stars in the cluster foreground. Such distinct populations may have different photometric, kinematic, and spectroscopic properties from those of σ Orionis (Jeffries et al. 2006; Sacco et al. 2007, 2008; Caballero & Solano 2008; Maxted et al. 2008; Hernández et al. 2014; Kounkel et al. 2018; Riaz et al. 2019), but disentangling them in the cluster halo (ρ ≈ 20–30 arcmin) requires a careful analysis. Here we use low-resolution optical spectroscopy, complemented with Gaia astrometry, for studying the σ Orionis membership of a large sample of stars and brown dwarfs.
2. Data and analysis
2.1. Sample
We obtained 317 low-resolution, long-slit optical spectra of 168 different sources comprising mostly high-to-low-mass stars selected from different surveys. Our sample includes OB, Herbig Ae/Be, T Tauri, variable, and binary stars, as well as brown dwarfs, in σ Orionis, but also young stars in neighbouring star-forming regions, fore- and background stars, and even one active galaxy. Most of them have youth features such as X-ray emission, mid-infrared excess, strong broad Hα emission, and Li I absorption, and have been identified as genuine σ Orionis cluster members using different techniques (e.g. Walter et al. 2008; Caballero 2008a, 2017; Hernández et al. 2014 – see below), while others are new member candidates or photometric candidates. As detailed in Sect. 2.2.1, 142 of those targets were observed with the Isaac Newton Telescope (INT) and 47 with the Gran Telescopio Canarias (GTC). For comparison purposes, 21 of them were observed with both telescopes. With GTC, we also observed 11 nearby standard stars with spectral types between K7 V and M6.5 V, which are listed in Table 1. The GTC spectra corresponding to 11 sources towards σ Orionis and six standard stars were previously published by Caballero et al. (2012).
Observations of standard stars for the OSIRIS spectral type classification.
2.2. Spectroscopy
2.2.1. Observations and reduction
The IDS at the INT. Observations at intermediate and low resolution were carried out using the Intermediate Dispersion Spectrograph (IDS) at the 2.5 m INT located at the Observatorio del Roque de los Muchachos in La Palma, Canary Islands, Spain. The IDS is a long-slit spectrograph attached at the INT Cassegrain focus equipped with a 235 mm focal length camera with two different possible 4k × 2k CCD detectors. For this work we used the EEV10 CCD. This latter is a blue-sensitive (> 50% efficiency from 400 to 700 nm) CCD that provides a spatial scale of 0.40 arcsec pixel−1 and an unvignetted 3.3 arcmin (500 pixels) slit length. All observations with IDS were performed in parallactic angle on six consecutive nights from 22 to 28 February 2007. We used two different gratings: R1200Y, which provides > 60% efficiency at 6000 Å and a spectral resolution of ∼1300, on the first five nights, and R150V, which provides a similar efficiency with a wider wavelength range but three times lower resolution, on the last night. Our instrument configuration is in Table 2.
Date of observations and instrument configurations.
The aim of the telescope proposal was to obtain optical spectroscopy of the 100 brightest young stars in σ Orionis, as well as of the maximum number possible of bright interloper stars towards the cluster. We list the names, equatorial coordinates, and main observing parameters of the 142 observed targets in Table A.1. We provide both the Mayrit identifier (Caballero 2008a) and the alternative (discovery) name for σ Orionis members. We took equatorial coordinates from Gaia DR2 (Gaia Collaboration 2016, 2018) in all cases except for a few particular ones, indicated in the table. We tabulate coordinates of the primary in close binary systems resolved by Gaia (Sect. 2.3). Six stars were observed with the two IDS grisms. Several stars were also observed a few times for improving the spectral signal-to-noise ratio but avoiding saturation (e.g. σ Ori AB), for daily monitoring (e.g. σ Ori E), or for minimising contamination using angles different from parallactic angle (e.g. 2MASS J05384652–0235479 = [BHM2009] SigOri-MAD-23, halfway between σ Ori AB and E). The weather during the observations was good in general, but with a variable seeing from 0.8 to 2.0 arcsec.
Data reduction was carried out using standard tasks within the IRAF software environment. The reduction of the 193 IDS spectra included bias and flat-field correction, removal of sky background, optimised aperture extraction, wavelength calibration using Cu–Ar and Cu–Ne arc lamps, instrumental response correction (calibrated with flux standard stars observed on the same nights for another programme), and hot-pixel and cosmic-ray removal. We checked the logbooks of the IDS observations for mistakes in target names, as well as for relevant remarks regarding signal-to-noise ratios or observed features. For stars with multiple observations and low signal-to-noise-ratio spectra (and the same grism), we combined the individual spectra for a higher signal. The spectra of two stars, 2MASS J05384652–0235479 and 2MASS J05381494–0219532, were of poor quality because of contamination from nearby sources and were discarded from the following analysis. The spectra of 18 normalised, fully reduced IDS spectra from O9.5+ V to M6 are shown in Fig. A.1.
The OSIRIS at the GTC. Observations were also carried out using the Optical System for Imaging and low Resolution Integrated Spectroscopy (OSIRIS) tunable imager and spectrograph (Cepa et al. 2000; Cepa 2010) at the 10.4 m GTC located at the Observatorio Roque de los Muchachos in La Palma, Canary Islands, Spain. OSIRIS has a mosaic of two 4k × 2k e2v Marconi CCD44-82-BI detectors, which provides an unvignetted field of view of 7.8 × 7.8 arcmin2 with a spatial scale of 0.127 arcsec pixel−1. To increase the signal-to-noise ratio, we selected the standard operation mode of the instrument, which implements a 2 × 2 binning mode with a readout speed of 100 kHz. All observations were carried out using the R1000B grism, which provides a peak efficiency of 65% at 5455 Å and covers the optical wavelength up to 7800 Å. Again, our instrument configuration is in Table 2.
The observations with OSIRIS were performed in service mode on different nights in March, November, and December 2012, and January 2013, through “D-band” filler programmes1 (Table A.2). Observations before 01 April 2012 were presented by Caballero et al. (2012). We list the names, equatorial coordinates, and main observing parameters of the 47 observed targets in Table A.2. As for IDS, we provide both the Mayrit identifiers and the alternative (discovery) name for the cluster members. We took coordinates from Gaia DR2 except for one source, indicated in the table. The aim of this filler programme was to obtain, within the GTC nightly operation schedule, high-quality low-resolution spectra of variable M stars with no previous spectroscopic characterisation and spectral type determination that are relatively bright for a 10 m-class telescope (with magnitudes of up to V ∼ 19 mag) but under poor weather conditions. However, the weather conditions were not very bad in general except for a few nights with dust and poor seeing. Most of the targets were observed at an airmass ≤ 1.6.
Data reduction was carried out using standard tasks within the IRAF software environment as in Caballero et al. (2012). All the 124 spectra of 47 sources towards Orion and 11 standard stars were bias-subtracted, corrected from flat-field using lamp flats from the GTC instrument calibration module, and were calibrated in wavelength using Xe, Ne, and Hg–Ar arc lamps. The reduction was followed by a sky-background subtraction and a one-dimension spectrum extraction, which were done taking into account the seeing conditions and exposure times. Finally, we applied a hot-pixel and cosmic-ray removal. The corresponding instrument-response correction was exactly the same as in Caballero et al. (2012). As for IDS, we combined the individual spectra of stars with multiple observations and with low signal-to-noise ratio (and the same grism). We discarded from the following analysis the source 2E 1456 (UCM0535–0246), a Seyfert 1 galaxy at z ∼ 0.1 previously considered to be a reddened low-mass σ Orionis member (Caballero et al. 2012). The spectra of five normalised, fully reduced OSIRIS spectra onto the spectral grid of the 11 standard stars are shown in Fig. A.2.
2.2.2. Equivalent widths
After discarding the two stars with poor-quality spectra and the galaxy, we kept 165 stars and brown dwarfs for the analysis. In the spectra of all of these objects, we measured equivalent widths (EWs) with errors of key spectral line targets using the IRAF splot task and the “equivalent width” function (conversely, we measured pseudo-EWs with respect to the pseudo-continuum in the K and M star spectra). For both IDS and OSIRIS spectra, we measured EWs of the Balmer lines Hα λ6562.80 Å, Hβ λ4861.33 Å, and the helium triplet He I D3 λ5875.67 Å in emission, and the lithium line Li I λ6707.80 Å in absorption. For OSIRIS we also measured the calcium doublet Ca H&K λλ3933.66,3968.47 Å and the Balmer line Hγλ4340.47 Å, which were present in most of the spectra, but also the Balmer Hδ, Hζ, Hη, H10, H11, H12 lines, the Mg I b triplet, the Na I D1 − 2 doublet (measured as a singlet because of the low resolution) and the He I line at λ6678.15 Å when measurable. Measured EWs of Hβ, He I D3, Hα, Li I (IDS and OSIRIS), Ca K, and Ca H (OSIRIS only) are shown in Tables A.3 and A.4.
2.2.3. Spectral types
For each target, we determined spectral types using the spectrum with the highest signal-to-noise ratio. For the targets observed at the INT with both R1200Y and R150V grisms we used only R1200Y. Depending on the instrument and stellar effective temperature, we followed three different strategies for determining the spectral type of all the stars.
MILES. We derived spectral types of the 140 analysable stars observed with IDS by comparing their spectra with synthetic ones generated with the MILES “Spectra by Stellar Parameters” webtool2 (Sánchez-Blázquez et al. 2006; Vazdekis et al. 2010; Falcón-Barroso et al. 2011). This tool allows the generation of synthetic stellar spectra of stars from 36 000 K down to 2750 K, which approximately correspond to O9 to M6 main sequence spectral types. The MILES spectra fully cover the range of spectral types in our sample and the wavelengths of most IDS spectra with a comparable spectral resolution (MILES: 0.90 Å pixel−1; R1200Y IDS: 0.48 Å pixel−1). However, MILES oversamples the spectra taken with the R150V grism, which has a dispersion of 3.66 Å pixel−1. For generating our own library of synthetic spectra, we used MILES with solar metallicities and surface gravities varying with effective temperature as described by Popper (1980). For the relation between temperatures and spectral types we used the relationships of Pecaut & Mamajek (2013) for K and M spectral types and those of Cox (2001) for earlier types. To perform the spectral type identification, first we classed the 140 spectra into 14 groups, sorted the spectra by approximate effective temperature within each group, and assigned a real (non-synthetic) MILES spectrum to each group. This grouping helped us to narrow down the interval of effective temperatures and surface gravities of each individual star, and to determine spectral types with a precision of about one subtype via a χ2 minimisation as in Alonso-Floriano et al. (2015). The results are listed under “SpT MILES” in Table A.3.
Standard stars. We derived spectral types of the 46 stars and brown dwarfs observed with OSIRIS towards σ Orionis using standard stars from K7 to M6.5 (Table 1), with a spectral typing precision of one subtype in this range. We assigned spectral types by fitting by eye the problem star to our grid of standard stars, which were observed with exactly the same instrument configuration (Fig. A.1). We took care to properly fit the (pseudo-)continuum and the strongest lines and bands in absorption, for which accurate wavelengths were taken from the “The Atomic Line List” webtool3. Unexpectedly, several stars had spectral types earlier than K7. A χ2 fitting as with MILES did not improve our visual determination. The results are listed under “SpT Standards” in Table A.4.
PyHammer. In addition to the previous strategies, we also used the “PyHammer” Python Spectral Typing Suite4 from Covey et al. (2007). PyHammer uses its own empirical templates of spectral types and metallicities to estimate the spectral type of a star by measuring prominent line indices and performing a weighted least-squares minimisation. It covers spectral types from O5 to L3 and metallicities from –2.0 dex to +1.0 dex. We applied the PyHammer algorithm to all our spectra from both IDS and OSIRIS. According to Covey et al. (2007), the accuracy provided by The Hammer, the basis on which PyHammer was built, is of around two subtypes. Having not investigated the differences between automatic and visual classifications of PyHammer, we assumed that the results are similar to those with The Hammer and OSIRIS/GTC as reported by Metodieva et al. (2015), who pointed out the improved accuracy of the tool for late M dwarfs. The resulting spectral types are listed in Tables A.3 and A.4 under “SpT PyHammer”.
Adopted spectral type. We report the finally adopted spectral type in Table A.5. In particular, we followed these criteria. We used the standard stars strategy for stars with spectral types K7–M6.5 observed with OSIRIS. For stars earlier than K7 observed with OSIRIS we used literature information (Mayrit 783254, 931117, 1042077, and [HHM2007] 648 from Hernández et al. 2014), PyHammer (Mayrit 1223121), or classical visual inspection of spectral features (Haro 5-17 and [HHM2007] 829). We used MILES for stars later than B0 observed with IDS (including those observed with OSIRIS). Finally, we used literature information for stars earlier than B0 observed with IDS (σ Ori AB itself; Simón-Díaz et al. 2015).
Of the 165 analysed stars, we present spectral types for the first time for 39 of them, and improve previous determinations in a few cases. In Fig. 1, we compare our spectral types to those of the literature. For example, there are half a dozen mid-K non-cluster-members that were classified as mid-G stars by Hernández et al. (2014). Figure 1 shows another two extreme outlier examples. Apart from these differences, the agreement with previous spectral determinations is generally within one or two subtype uncertainties.
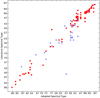 |
Fig. 1. Literature and adopted spectral types. Red filled circles and blue crosses stand for cluster members and non-members, respectively. Literature spectral types were retrieved from Greenstein & Keenan (1958), Guetter (1981), Nesterov et al. (1995), Wolk (1996), Houk & Swift (1999), Zapatero Osorio et al. (2002), Sacco et al. (2008), Caballero et al. (2008, 2012), Manara et al. (2013), and Hernández et al. (2014). The G7 star previously classified as A0 is “IDS 05335–0238 D”; the early spectral type may actually correspond to a close-by early A star at a few arcseconds (Hernández et al. 2014). The F7 star previously classified as K0 is Mayrit 968292; the late-G/early-K estimation from photometry by Caballero (2008a) was incorrect. |
2.3. Gaia DR2
At the moment of observation, equatorial coordinates were taken from the Two-Micron All-Sky Survey (2MASS; Skrutskie et al. 2006). However, we tabulate here the latest Gaia DR2 coordinates (Gaia Collaboration 2018). We used both Topcat5 and Aladin6 Virtual Observatory tools with a small cross-match radius of 1.5 arcsec, and compared our results with those of Caballero (2017). Apart from the equatorial coordinates (Sect. 2.2.1), we also retrieved parallaxes, proper motions, radial velocities, and broadband magnitudes of the 165 stars and brown dwarfs. For the nine stars without Gaia DR2 parallaxes and proper motions, we took them from the existing literature (van Altena et al. 1995; Zacharias et al. 2005; van Leeuwen 2007; Altmann et al. 2017). Both proper motions and parallaxes are listed in Tables A.1 (IDS) and A.2 (OSIRIS), and are discussed in Sect. 3.1. The histograms of total proper motions and parallaxes for the complete sample are shown in Fig. 2. Gaia DR2 radial velocities are discussed in Sect. 3.3. Magnitudes will be presented in a forthcoming publication.
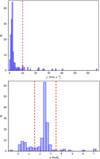 |
Fig. 2. Histograms of Gaia DR2 total proper motions (top) and parallaxes (bottom). Vertical dashed lines indicate the conservative σ Orionis boundary limits explained in Sect. 3.1. The bin sizes of these histograms have been adjusted according to Freedman & Diaconis (1981). |
2.4. Youth features
We complemented our IDS, OSIRIS, and Gaia DR2 data with an exhaustive literature compilation of features of youth to support our determination of membership to the σ Orionis cluster. Below we describe each of the features that we looked for, together with EW(Li I) and EW(Hα) from our spectra.
Lithium. Li I λ6707.80 Å is the main indicator of youth in stars later than mid-F spectral type (Bertout 1989; Carlsson et al. 1994; Montes et al. 2001a; Zapatero Osorio et al. 2002). We highlight the fact that for open clusters as young as σ Orionis (τ ∼ 3 Ma) this is true only for low-mass stars with K and M spectral types, as Sun-like stars (spectral types F and G) do not have a deep convection zone and therefore lithium depletion occurs on longer time scales (Soderblom et al. 2014). We measured EW(Li I) in absorption in the IDS and OSIRIS spectra of 78 stars (Table A.5). Because of the low resolution of our spectra, especially for those obtained with OSIRIS and IDS R150V, we conservatively set a lower limit at EW(Li I) = 0.1 Å for claiming a true detection. We complemented our measurements with previous EW(Li I) values published by Zapatero Osorio et al. (2002), Kenyon et al. (2005), Sacco et al. (2008), and Hernández et al. (2014). Observations with higher spectral resolution and signal-to-noise ratio would be needed to disentangle the two populations of G- and K-type stars with very young ages in σ Orionis and with juvenile ages of up to 30 Ma in the cluster foreground.
Balmer series. In very young stars, Hα λ6562.80 Å can be in emission because of chromospheric emission or accretion from a circumstellar disc (Cram & Mullan 1979; Stauffer & Hartmann 1986; Bertout 1989; Barrado y Navascués & Martín 2003). We complemented our measurements with previous EW(Hα) values or remarks published by Zapatero Osorio et al. (2002), Kenyon et al. (2005), Caballero (2008a), Sacco et al. (2008), and Hernández et al. (2014).
OB stars. Massive stars of early O and B spectral types stay in the main sequence for only a few million years. There are no evolved (i.e. giant) early-type stars in σ Orionis, providing evidence for its extreme youth. Except for one anomalous example of a background B-type star, all O- and B-type stars in our sample, which were also the brightest targets that required the shortest exposure times, belong to the cluster (Caballero et al. 2007; Caballero 2008a – but see Sherry et al. 2008).
Mid-infrared. The flux excess in the mid-infrared (MIR) is produced by the presence of circum(sub)stellar discs around stars and brown dwarfs, and is often detected at the early stages of star formation (Muench et al. 2001; Lada et al. 2006; Fűrész et al. 2008). We searched for MIR indicators and Class I, II, and evolutionary and transition disc classification in Hernández et al. (2007), Luhman et al. (2008), and mostly compiled by Caballero (2008a).
X-rays. Although Garrison (1967) and Lyngå (1982) had already identified the star clustering, the importance of σ Orionis as a milestone star-forming region began with the discovery by Wolk (1996) of an agglomerate of intense X-ray-emitting stars densely concentrated around the eponymous σ Ori multiple star system. In general, the origin of X-ray emission lies on fast rotation and deep convective zones or wind collision (Pallavicini et al. 1981; Stelzer & Neuhäuser 2001; Favata & Micela 2003; Preibisch et al. 2005), depending on stellar mass. Here, we compiled X-ray detections from Franciosini et al. (2006), Skinner et al. (2008), López-Santiago & Caballero (2008), and Caballero et al. (2009, 2010).
Proper motion and parallax. Per se, proper motion (μ) and parallax (ϖ) are not youth features. However, all cluster members share common characteristics. In particular, they are located approximately in the same region of the sky and at the same distance, they move in the same direction with the same traverse velocity, have the same age and metallicity, and are born from the same parental cloud. Members within the μ and ϖ boundaries of the cluster are likely to have youth features. Vice versa, stars with μ and ϖ outside the cluster boundaries are likely to be devoid of youth features.
3. Results and discussion
3.1. Cluster membership
We used all available information to determine membership in σ Orionis of the 165 spectroscopically observed stars and brown dwarfs. We followed a step-by-step process, summarised in Table A.5:
– First, we discarded four T Tauri stars discovered by Haro & Moreno (1953) in neighbouring star-forming regions: Haro 5-17 in the eastern outskirts of the ϵ Orionis cluster (Collinder 1931; Caballero & Solano 2008), Haro 5-40 and Haro 5-44 near the Horsehead nebula (Pound et al. 2003; Habart et al. 2005; Goicoechea et al. 2006), and Haro 5-46 close to the Flame nebula (Mezger et al. 1988; Barnes et al. 1989; Bik et al. 2003). The four Hα-emitter stars are located to the west of the Ori OB1b association, but at angular separations much greater than the extension of the halo of the σ Orionis cluster at 0.5 deg from the cluster centre, which is defined by the σ Ori Trapezium-like system (Caballero 2008b). The remaining 161 stars and brown dwarfs were located at less than 0.5 deg from the centre.
– We next applied the same astrometric criteria with Gaia DR2 data for cluster membership as in Caballero (2018), which represented an improvement with respect to those presented in Caballero (2010a). In particular, we discarded 51 stars with total proper motions μ > 10 mas a−1 and/or parallaxes less than 1.5 mas or greater than 3.5 mas. The parallax criterion translated into discarding all stars with distances outside the 290–670 pc interval (assuming d = 1/ϖ; the precise σ Orionis distance of Schaefer et al. 2016 was 387.5 ± 1.3 pc). Careful inspection of the six Gaia DR2 sources with parallax uncertainties greater than 20% led to the recovery of Mayrit 1073209, an M3.0 star with youth features but with poor Gaia DR2 astrometric quality flags (astrometric_gof_al, astrometric_chi2_al, astrometric_excess_noise and, especially, the [re-normalised] unit-weight errors UWE and RUWE)7.
– Of the 110 remaining stars we identify OB spectral types in 11 cases, Li I in absorption in 87 (34 for the first time) cases, Hα in emission in 67 (12 for the first time) cases, MIR excess in 46 cases, and X-ray emission in 63 cases. A few photometric cluster member candidates continue in the same state.
As expected, none of the astrometrically discarded stars displayed lithium in absorption, MIR excess, or X-ray emission. Many do not follow the spectro-photometric cluster sequence, either. However, there are two distant stars with faint and strong Hα emission: IRAS 05358–0238 and StHa 50, respectively. The former is an evolved star at  kpc (Bailer-Jones et al. 2018) with a weak silicate feature and structure in the 10–12 μm range (Oliveira & van Loon 2004), while the later is an unusual, isolated Herbig Ae/Be star in the background at
  kpc (Caballero 2017; Bailer-Jones et al. 2018). In spite of having been identified as a non-cluster-member over a decade ago (Caballero 2008a), IRAS 05358–0238 has since been observed with expensive facilities such as SCUBA and Herschel (Williams et al. 2013; Maucó et al. 2016).
Of the 51 foreground and background stars, 16 have previously been classified as such (e.g. Warren & Hesser 1977; Sherry et al. 2004; Caballero 2007). However, remarkably, 35 stars, which are listed in Table 3, were classified as cluster-member candidates in the extensive surveys of Hernández et al. (2007) and Caballero (2008a). Although additional cluster member candidates were discarded afterwards (e.g. in previous items of this series of papers or by Hernández et al. 2014), such a large number of new non-members has serious implications for a number of key science cases in the σ Orionis cluster. We qualitatively outline below some of the most relevant implications: (i) Hernández et al. (2007) determined frequencies of discs in a sample of 336 σ Orionis Herbig Ae/Be and T Tauri star candidates ranging from 10% to 35%, approximately, depending on stellar mass. A stellar population smaller by 10% may translate into an increase in the frequency of discs in intermediate-mass T Tauri stars to almost 40%; (ii) Peña Ramírez et al. (2012) determined the most comprehensive mass function (mass spectrum) of the cluster from about 20 M⊙ to about 0.005 M⊙ (see also Caballero 2011). These latter authors built this mass spectrum with the help of the Mayrit catalogue (Caballero 2008a) with the latest updates available that moment. The lack of 27 stars with estimated masses around 0.5 M⊙ can make a sharper contrast between the steep Salpeter’s region at more than 1 M⊙ and the almost flat slope of the mass spectrum at the lowest masses (Kroupa 2001; Chabrier 2003; iii) Most of the discarded stars are located relatively far from the cluster centre8. Therefore, while the cluster core may follow the same power law in the radial distribution presented by Caballero (2008b), the halo at angular separations ρ ≳ 20 arcsec could be even more rarefied. In other words, σ Orionis could be more compact than previously thought, which would ease the separation of its young population from other nearby young populations (Horsehead and Flame nebulae, ϵ Orionis); (iv) To date, the only metallicity determination based on a significantly large sample of stars in the cluster was performed by González Hernández et al. (2008). Looking back to their stellar sample with our current knowledge, the average cluster [Fe/H] value may be different from what they derived, albeit still near solar.
Previous cluster member candidates discarded in this work.
Regarding cluster members and member candidates in particular, while there are a few stars with the four youth features (Li I, Hα, MIR, X-rays), apart from μ and d within the suitable intervals, there are also some member candidates that only follow the spectro-photometric sequence of the cluster. This is the case especially for relatively inactive A- and early-F-type stars, which have hot effective temperatures that prevent the formation of Li I and of deep convective zones (and, thus, strong magnetic fields) and, in addition, have short disc-dissipation times. The list of photometric members without spectroscopic confirmation includes Mayrit 11238 (σ Ori C itself; A2 V). Besides, Mayrit 1227243 (HD 294275; A1 V) was classified by Caballero (2017) as a non-cluster-member based on a TGAS (Altmann et al. 2017) parallax that was quite different from the new Gaia DR2 one, which is compatible with cluster membership, and therefore it stands as a photometric member candidate.
In addition, we identified for the first time spectral features of youth (especially, but not only, Li I) in six stars that were previously photometric cluster-member candidates: Mayrit 144349, 1042077, 1082115, 1273081, and 1476077. We also assigned new Mayrit designations to two stars: Mayrit 1045067AB ([BMZ2001] S Ori J053948.1–022914; M3.0), for which lithium was not appreciable in our OSIRIS spectrum but for which low-gravity features were detected by Burningham et al. (2005), and Mayrit 1042077 ([HHM2007] 1250; K7), with a new Li I detection. Some faint targets with controvertible detections of youth features, such as Mayrit 1298302 and Mayrit 1500066, require further investigation.
Figure 3 shows the measured EW(Li I) as a function of adopted spectral type. The earliest σ Orionis star for which we measured EW(Li I) is Mayrit 1285339 (HD 294268; F8 e). Pérez-Blanco et al. (2018) classified this object as a relatively evolved star in the sparse population of the Orion OB1 association. Our classification as a true cluster member is in accordance with the fact that the star hosts a transitional disc (Williams et al. 2013; Brown et al. 2013; Ansdell et al. 2017; Péricaud et al. 2017). However, since there are Herbig Ae/Be and classical T Tauri stars (with different kinds of discs) in the sparse population of the Orion OB1 association (e.g. Hernández et al. 2005; Briceño et al. 2019), there is still a possibility that Mayrit 1285339 actually belongs to that sparse population and not to the σ Orionis cluster. This argument is supported mainly by the radial velocity analysis of Pérez-Blanco et al. (2018). Mayrit 1285339 and some G- and K-type stars observed with IDS R1200Y and EW(Li I) within the envelopes of the Pleiades cluster are discussed in Sect. 3.3.
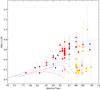 |
Fig. 3. Measured Li I EWs as a function of adopted spectral type. Filled red circles show young targets observed with IDS R1200Y; open red circles show young targets observed with IDS R150V (controvertible); filled orange circles show young targets observed with OSIRIS R100B; blue crosses show non-member stars with Li I (Haro 5-17 and Haro 5-46); solid magenta lines show upper and lower EW(Li I) envelopes of the Pleiades (τ ∼ 120 Ma – Soderblom et al. 1993; Montes et al. 2001b); and the dashed cyan line shows the upper EW(Li I) envelope of IC 2602 (τ ∼ 30 Ma – Neuhäuser et al. 1997). |
3.2. Strong accretors
The Hα line is the atomic line for which we have the largest number of measurements, either in emission or in absorption. Figure 4 shows the distribution of our EW(Hα) measurements. The vast majority of these lie in the interval from +17 Å in absorption (for late B and early A stars) to –40 Å in emission. However, there is a tail of very strong emitters, with EW(Hα) down to –160 Å, which correspond to objects that undergo accretion from a circum(sub)stellar disc. In particular, there are 40 σ Orionis stars and brown dwarfs in our sample that satisfy the Barrado y Navascués & Martín (2003) criterion for separating classical T Tauri objects with accretion from weak-line T Tauri objects with chromospheric activity. One non-cluster-member, the background Herbig Ae/Be star StHa 50, is above the coarse extrapolation of that criterion to spectral types earlier than K. The four discarded T Tauri stars discovered by Haro & Moreno (1953) are also above the accretional/chromospheric activity boundary (Fig. 5).
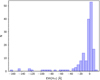 |
Fig. 4. Histogram of the number of sources as a function of the measured EW(Hα). The bin size of this histogram has been adjusted according to Freedman & Diaconis (1981). |
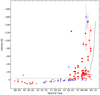 |
Fig. 5. Measured EW(Hα) of our sample of stars as a function of adopted spectral type. The black dashed line shows the curve fitting from K0 to L0 of the EWs used in Barrado y Navascués & Martín (2003) as an empirical criterion for identifying classical T Tauri stars. The black dotted line shows the coarse extrapolation of the Barrado y Navascués & Martín (2003) criterion to spectral types earlier than K0 (EW(Hα) = –3.9 Å). Big and small red filled circles indicate cluster member stars and brown dwarfs with EWs above and below the black lines, respectively. Big and small blue crosses show non-cluster-member stars with EWs above and below the black lines, respectively. The early K-type σ Orionis star with strong emission is Mayrit 871071 (Haro 5-27, V510 Ori), the driving source of the jet HH 444 (Reipurth et al. 1998; López-Martín et al. 2001). |
Of the 40 accreting cluster members, 12 are young cluster members with EW(Hα) < –50 Å, and are listed in Table 4, together with two Haro objects in IC 434. All of these 12 also have EW(Hβ) < –12 Å and significant emission in all observable Balmer lines, except for the M6.5-type brown dwarf Mayrit 1196092 (J ≈ 15.3 mag), whose blue spectrum is too noisy. Table 4 includes: the brown dwarf mentioned immediately above; two objects at the stellar/substellar boundary at J ≈ 14.5 mag (Caballero et al. 2007), namely Mayrit 1316178 and Mayrit 1364078, which also have M6.5 adopted spectral types; seven photometrically variable sources (Fedorovich 1960; Caballero et al. 2004); three stars with Li I in absorption detected for the first time; and three stars and one brown dwarf with EW(Hα) measured for the first time (including the two Haro stars in IC 434).
Strongly accreting stars and brown dwarfs with EW(Hα) < –50 Å.
After correcting heliocentric radial velocities using the IRAF bcvcorr task and smoothing the spectra with grade-two splines, we measured the shift of the centroid of the Hα line (Fig. 6) and found five stars with displacements with respect to the air wavelength greater than 2.5 Å, which translates into gas velocities greater than about 120 km s−1. These five stars are ideal targets for searches for new faint jets in σ Orionis as discovered recently by Riaz et al. (2019).
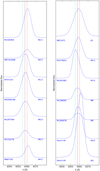 |
Fig. 6. Normalised spectra around Hα λ6562.80 Å of the 14 strong accretors in Table 4. The vertical lines show the Hα line shifted by –2.5 Å (cyan), 0.0 Å (black), and +2.5 Å (red). |
Remarkably, nine of the 14 stars in Table 4 were discovered in objective-prism photographic plates by a small team of Mexican astronomers back in the middle of the twentieth century (Haro & Moreno 1953).
3.3. Binaries
On the one hand, in Fig. 3 there are two mid-type stars with relatively small EW(Li I) for their effective temperatures. These are Mayrit 863116 (HD 294300; G4) and Mayrit 1415279AB (OriNTT 429; K1). The latter is a spectroscopic binary discovered by Lee et al. (1994). As discussed in detail by Caballero (2010b)9, this double star shows a lower EW(Li I) than its actual value when observed in low spectral resolution (the combined spectrum of the red- and blueshifted components is smoothed by the low resolution).
On the other hand, there are another two classical T Tauri stars in Fig. 3 with youth features and proper motions consistent with σ Orionis membership, but with abnormal Gaia DR2 parallaxes and low-quality astrometric flags. These are Mayrit 359179AB (V595 Ori) and Mayrit 873229AB (Haro 5-7), which were classified by Caballero et al. (2018) as a resolved binary and a binary candidate, respectively, with angular separations ρ < 1 arcsec (Mayrit 873229AB is also a double-line spectroscopic binary; Maxted et al. 2008).
Based on these two facts, close binarity could explain part of the scatter in the EW(Li I) versus spectral-type diagram in Fig. 3 (and in colour-magnitude diagrams), as well as inconsistencies between spectroscopic and astrometric data. Multiplicity in the σ Orionis cluster was reviewed in detail by Caballero (2014) and updated by Caballero et al. (2018). Following the procedure of the latter publication, we looked in Gaia DR2 for close binaries (ρ < 4 arcsec) among the investigated stars. Our results are summarised in Table 5.
Young binary stars in our sample resolved by Gaia.
With the help of the Topcat Virtual Observatory tool, we identified and measured angular separation ρ, position angle θ, and magnitude difference in the Gaia broadband filter ΔG for 11 σ Orionis stars (at Gaia DR2 epoch J2015.5). We were also able to measure magnitude differences in the blue and red Gaia filters ΔBp and ΔRp for 5 of those 11. Of the 11 binaries, 6 had been discovered by Caballero (2008a, 2010a,b) and Caballero et al. (2018). Another two, indicated with parenthesis under “Reference” in Table 5, were presented as binary candidates by Caballero et al. (2018), but these latter authors were only able to impose upper limits on angular separation. In summary, we discovered three new close binaries, namely Mayrit 329261AB, Mayrit 1045067AB, and Mayrit 1248183AB, and measured ρ and θ for the first time for another two close binaries, namely Mayrit 873229AB and Mayrit 1626148AB. Of these five objects, only the equal-mass Mayrit 1045067AB binary has an angular separation greater than 0.90 arcsec. The eponymous σ Ori multiple system, which contains at least five stars with spectral types between B2 V and O9.5 V (Caballero 2014; Simón-Díaz et al. 2015; Maíz Apellániz et al. 2018, and references therein), is not resolved by Gaia.
As illustrated by Fig. 7, we also retrieved Gaia DR2 radial velocities for 14 σ Orionis stellar members (and for 32 non-cluster-members), and found three young stars with radial velocities discordant with that of the cluster by more than 3σ: Mayrit 822170 ([W96] 4771–0119), Mayrit 1275190, and Mayrit 1285339 (HD 294268). The case of the T Tauri star Mayrit 822170 is striking, as it has lithium in absorption and Hα and X-rays in emission but a radial velocity of –32 ± 6 km s−1, vastly different from the +31.10 ± 0.16 km s−1 determined by Simón-Díaz et al. (2015) for the open cluster. We looked for additional radial-velocity determinations on these three stars in the studies by Jeffries et al. (2006), Caballero (2010b), Maxted et al. (2008), Sacco et al. (2008), Hernández et al. (2014), and Kounkel et al. (2018). Our findings are summarised in Table 6. The observed discordances are likely due to membership to the sparse foreground population of the Orion OB1 association (Mayrit 1275190 and, especially, Mayrit 1285339; Pérez-Blanco et al. 2018) or to the presence of an unseen companion (Mayrit 822170). The same may apply to the other young stars with low EW(Li I) for their spectral type or abnormal radial velocities and parallaxes. If both Mayrit 1275190 and Mayrit 1285339, at 21.3–21.4 arcmin to the cluster centre, actually belonged to a distinct population, the list of previous cluster member candidates discarded in this work (Table 3) would increase to 37 and in addition σ Orionis would be spatially more compact.
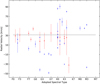 |
Fig. 7. Gaia DR2 radial velocity as a function of adopted spectral type. Red and blue circles highlight σ Orionis stars and non-cluster-member stars, respectively; coloured vertical error bars show 3σ uncertainties; and the black horizontal line shows the σ Ori systemic velocity γ = +31.10 ± 0.16 km s−1. |
Three Mayrit stars with discordant radial velocities.
There are six tight binary systems among the 11 investigated Gaia DR2 sources with the highest RUWE values (Sect. 3.1): σ Ori AB (ρ ≈ 0.266 arcsec – Burnham 1892; Turner et al. 2008; Simón-Díaz et al. 2011), Mayrit 528005AB ([W96] 4771–899, ρ ≈ 0.40 arcsec – Caballero 2005), and four of the five young binary stars in our sample resolved by Gaia (Table 5) with angular separations between 0.6 and 1.0 arcsec. All six have RUWE values greater than 3.8, much larger than the maximum value of 1.4 recommended for reliable astrometry by the Gaia Data Processing and Analysis Consortium (cf., Sect. 3.1). The fifth resolved binary, with ρ ≈ 0.90 arcsec, ΔG ≈ 3.00 mag, and RUWE ≈ 1.23, is Mayrit 329261AB ([SWW2004] 207), for which Sherry et al. (2004) reported a very nearby source with similar optical magnitudes ([SWW2004] 103). The other five stars sorted by RUWE values from 21.8 to 5.0 are Mayrit 203283, 1082115, 1073209, 521199, and 157155. All five of them have at least Li I in absorption and are thought to be single, with one of them, namely Mayrit 521199 (TX Ori), displaying all the attributes of a classical T Tauri star. Alternatively, these five objects could be tight binaries yet unresolved by Gaia, with angular separations of 0.5 arcsec or less.
4. Summary
We present a new detailed characterisation of 111 σ Orionis cluster members with spectral types from O9.5 to M6.5, 4 T Tauri stars in neighbouring star-forming regions, and 51 foreground and background stars. Our target sample includes OB stars in Trapezium-like systems, Herbig Ae/Be and T Tauri stars, and brown dwarfs with ages of about 3 Ma, in addition to peculiar interloper stars of different ages and evolutionary stages.
We used low-resolution optical spectroscopy collected with IDS at the INT and OSIRIS at the GTC to identify new youth features (mostly Li I in absorption and Balmer lines in emission) and to determine spectral types, Gaia DR2 proper motions, parallaxes, and photometry. We also used Virtual Observatory tools to astrometrically discard cluster members and to find close binaries, and literature information, such as X-ray emission, MIR flux excess, and previous measurements of Li I and Hα, for previous and relevant information. The combination of all these data allowed us to carry out an exhaustive membership classification and thereby form a more detailed picture of the σ Orionis stellar and substellar populations.
Perhaps the most remarkable result is the finding that 35 of those 51 non-cluster-member stars were previously classified and considered as cluster members in highly cited works on disc frequency and characterisation, initial mass function, spatial distribution, and chemical abundances. These 35 stars represent about 10% of the whole σ Orionis stellar population, and very likely a higher fraction at intermediate masses (ℳ ∼ 0.5–1.0 M⊙), which has a significant impact on the results shown in previous works.
In addition, we have found: 14 strong accretors with EW(α) < –50 Å, of which 2 are new identifications and 4 have measured EW(Hα) for the first time; 5 strong accretors with signficant blue- or redshift of the Hα line, which can host undetected jets; 11 astrometric binaries with angular separations of 0.6–3.2 arcsec, of which 3 are discovered here and 5 have measured ρ and θ for the first time; 2 juvenile star candidates in the sparse population of the Ori OB1b association; and one spectroscopic candidate based on Gaia DR2 radial velocities. Another five cluster members could be tight binaries based on large values of Gaia DR2 re-normalised unit-weight errors.
This fourth paper of the series “Stars and brown dwarfs in the σ Orionis cluster” is a follow-on of the comprehensive analysis of the very young open cluster with perhaps the best-studied stellar and substellar populations. It is also a preliminary step for the improvement in the determination of key parameters in star formation: metallicity, multiplicity, slope of the mass spectrum, disc and jet frequency, and spatial concentration across the huge mass interval from 20 to 0.005 M⊙.
D-band proposals (or fillers) require very relaxed observing conditions and cover a wide range of coordinates so that they can be carried out at essentially any moment during the semester. Observations in this band are only executed if the observing conditions do not permit observations of proposals in A, B, or C bands (http://www.gtc.iac.es/observing/).
The Mayrit number indicates the angular separation to and position angle from the cluster centre; e.g. Mayrit 1045067 is at ρ ≈ 1045 arcsec and θ ≈ 67 deg from σ Ori AB.
This is a summary in English of Caballero (2006, PhD Thesis, Universidad de La Laguna, Spain).
Acknowledgments
We thank the anonymous referee for the careful review, J. Sanz-Forcada for helpful comments on X-rays, and R. Campillo for starting working on the data during his MSc thesis. This article is based on observations made in the Observatorios de Canarias del IAC with the Gran Telescopio Canarias and Isaac Newton Telescope of the Isaac Newton Group of Telescopes, both installed at the Spanish Observatorio del Roque de los Muchachos of the Instituto de Astrofísica de Canarias, in the island of La Palma, Spain, under programs INT15-07A, GTC55-12A, and GTC30-12B. This research made use of the SIMBAD, operated at Centre de Données astronomiques de Strasbourg, France, and NASA’s Astrophysics Data System. Financial support was provided by the Universidad Complutense de Madrid, the Comunidad Autónoma de Madrid, the Spanish Ministerio de Ciencia, Innovación y Universidades and the European FEDER/ERF funds under grants AYA2016-79425-C3-1/2-P and the Centre of Excellence “Severo Ochoa” and “María de Maeztu” awards to the Instituto de Astrofísica de Canarias (SEV-2015-0548) and Centro de Astrobiología (MDM-2017-0737).
References
- Alonso-Floriano, F. J., Morales, J. C., Caballero, J. A., et al. 2015, A&A, 577, A128 [NASA ADS] [CrossRef] [EDP Sciences] [Google Scholar]
- Altmann, M., Roeser, S., Demleitner, M., Bastian, U., & Schilbach, E. 2017, A&A, 600, L4 [NASA ADS] [CrossRef] [EDP Sciences] [Google Scholar]
- Álvarez-Meraz, R., Nagel, E., Rendon, F., & Barragán, O. 2017, Rev. Mex. Astron. Astrofis., 53, 275 [NASA ADS] [Google Scholar]
- Ansdell, M., Williams, J. P., Manara, C. F., et al. 2017, AJ, 153, 240 [NASA ADS] [CrossRef] [EDP Sciences] [Google Scholar]
- Bailer-Jones, C. A. L., Rybizki, J., Fouesneau, M., Mantelet, G., & Andrae, R. 2018, AJ, 156, 58 [NASA ADS] [CrossRef] [Google Scholar]
- Barnes, P. J., Crutcher, R. M., Bieging, J. H., Storey, J. W. V., & Willner, S. P. 1989, ApJ, 342, 883 [NASA ADS] [CrossRef] [Google Scholar]
- Barrado y Navascués, D., & Martín, E. L. 2003, AJ, 126, 2997 [NASA ADS] [CrossRef] [Google Scholar]
- Béjar, V. J. S., Osorio, M. R. Z., & Rebolo, R. 1999, ApJ, 521, 671 [NASA ADS] [CrossRef] [Google Scholar]
- Bertout, C. 1989, ARA&A, 27, 351 [NASA ADS] [CrossRef] [Google Scholar]
- Bik, A., Lenorzer, A., Kaper, L., et al. 2003, A&A, 404, 249 [NASA ADS] [CrossRef] [EDP Sciences] [Google Scholar]
- Boesgaard, A. M., & Tripicco, M. J. 1986, ApJ, 302, L49 [NASA ADS] [CrossRef] [Google Scholar]
- Bouvier, J., Barrado, D., Moraux, E., et al. 2018, A&A, 613, A63 [NASA ADS] [CrossRef] [EDP Sciences] [Google Scholar]
- Briceño, C., Calvet, N., Hernández, J., et al. 2019, AJ, 157, 85 [NASA ADS] [CrossRef] [Google Scholar]
- Brown, J. M., Pontoppidan, K. M., van Dishoeck, E. F., et al. 2013, ApJ, 770, 94 [NASA ADS] [CrossRef] [Google Scholar]
- Burnham, S. W. 1892, Astron. Nachr., 130, 257 [NASA ADS] [CrossRef] [Google Scholar]
- Burningham, B., Naylor, T., Littlefair, S. P., & Jeffries, R. D. 2005, MNRAS, 356, 1583 [NASA ADS] [CrossRef] [Google Scholar]
- Caballero, J. A. 2005, Astron. Nachr., 326, 1007 [NASA ADS] [CrossRef] [Google Scholar]
- Caballero, J. A. 2007, A&A, 466, 917 [NASA ADS] [CrossRef] [EDP Sciences] [Google Scholar]
- Caballero, J. A. 2008a, A&A, 478, 667 [NASA ADS] [CrossRef] [EDP Sciences] [Google Scholar]
- Caballero, J. A. 2008b, MNRAS, 383, 375 [NASA ADS] [Google Scholar]
- Caballero, J. A. 2010a, A&A, 514, A18 [NASA ADS] [CrossRef] [EDP Sciences] [Google Scholar]
- Caballero, J. A. 2010b, Astrophys. Space Sci. Proc., 14, 79 [NASA ADS] [CrossRef] [Google Scholar]
- Caballero, J. A. 2011, Stellar Clusters & Associations: A RIA Workshop on Gaia, 108 [Google Scholar]
- Caballero, J. A. 2014, Observatory, 134, 273 [NASA ADS] [Google Scholar]
- Caballero, J. A. 2017, Astron. Nachr., 338, 629 [NASA ADS] [CrossRef] [Google Scholar]
- Caballero, J. A. 2018, Res. Notes Am. Astron. Soc., 2, 25 [NASA ADS] [CrossRef] [Google Scholar]
- Caballero, J. A., & Solano, E. 2008, A&A, 485, 931 [NASA ADS] [CrossRef] [EDP Sciences] [Google Scholar]
- Caballero, J. A., Béjar, V. J. S., Rebolo, R., & Zapatero Osorio, M. R. 2004, A&A, 424, 857 [NASA ADS] [CrossRef] [EDP Sciences] [Google Scholar]
- Caballero, J. A., Béjar, V. J. S., Rebolo, R., et al. 2007, A&A, 470, 903 [NASA ADS] [CrossRef] [EDP Sciences] [Google Scholar]
- Caballero, J. A., Valdivielso, L., Martín, E. L., et al. 2008, A&A, 491, 515 [NASA ADS] [CrossRef] [EDP Sciences] [Google Scholar]
- Caballero, J. A., López-Santiago, J., de Castro, E., & Cornide, M. 2009, AJ, 137, 5012 [NASA ADS] [CrossRef] [Google Scholar]
- Caballero, J. A., Albacete-Colombo, J. F., & López- Santiago, J. 2010, A&A, 521, A45 [NASA ADS] [CrossRef] [EDP Sciences] [Google Scholar]
- Caballero, J. A., Cabrera-Lavers, A., García-Álvarez, D., & Pascual, S. 2012, A&A, 546, A59 [NASA ADS] [CrossRef] [EDP Sciences] [Google Scholar]
- Caballero, J. A., Bouy, H., & Lillo-Box, J. 2016, Observatory, 136, 226 [NASA ADS] [Google Scholar]
- Caballero, J. A., Novalbos, I., Tobal, T., & Miret, F. X. 2018, Astron. Nachr., 339, 60 [NASA ADS] [CrossRef] [Google Scholar]
- Carlsson, M., Rutten, R. J., Bruls, J. H. M. J., & Shchukina, N. G. 1994, A&A, 288, 860 [NASA ADS] [Google Scholar]
- Cepa, J. 2010, Astrophys. Space Sci. Proc., 14, 15 [Google Scholar]
- Cepa, J., Aguiar, M., Escalera, V. G., et al. 2000, in Optical and IR Telescope Instrumentation and Detectors, Proc. SPIE, 4008, 623 [NASA ADS] [CrossRef] [Google Scholar]
- Chabrier, G. 2003, PASP, 115, 763 [NASA ADS] [CrossRef] [Google Scholar]
- Chaffee, F. H., Carbon, D. F., & Strom, S. E. 1971, ApJ, 166, 593 [NASA ADS] [CrossRef] [Google Scholar]
- Cody, A. M., & Hillenbrand, L. A. 2014, ApJ, 796, 129 [NASA ADS] [CrossRef] [MathSciNet] [Google Scholar]
- Collinder, P. 1931, Ann. Obs. Lund, 2, B1 [Google Scholar]
- Cottle, J. N., Covey, K. R., Suárez, G., et al. 2018, ApJS, 236, 27 [NASA ADS] [CrossRef] [Google Scholar]
- Covey, K. R., Ivezić, Ž., Schlegel, D., et al. 2007, AJ, 134, 2398 [NASA ADS] [CrossRef] [Google Scholar]
- Cox, A. N. 2001, Allen’s Astrophysical Quantities (Berlin: Springer) [Google Scholar]
- Cram, L. E., & Mullan, D. J. 1979, ApJ, 234, 579 [NASA ADS] [CrossRef] [EDP Sciences] [Google Scholar]
- Davison, C. L., White, R. J., Henry, T. J., et al. 2015, AJ, 149, 106 [NASA ADS] [CrossRef] [Google Scholar]
- Elliott, P., Scholz, A., Jayawardhana, R., Eislöffel, J., & Hébrard, E. M. 2017, A&A, 608, A66 [NASA ADS] [CrossRef] [EDP Sciences] [Google Scholar]
- Falcón-Barroso, J., Sánchez-Blázquez, P., Vazdekis, A., et al. 2011, A&A, 532, A95 [NASA ADS] [CrossRef] [EDP Sciences] [Google Scholar]
- Favata, F., & Micela, G. 2003, Sci. Space Rev., 108, 577 [NASA ADS] [CrossRef] [Google Scholar]
- Fedorovich, V. P. 1960, Perem. Zvezdy, 13, 166 [NASA ADS] [Google Scholar]
- Fűrész, G., Hartmann, L. W., Megeath, S. T., Szentgyorgyi, A. H., & Hamden, E. T. 2008, ApJ, 676, 1109 [NASA ADS] [CrossRef] [Google Scholar]
- Franciosini, E., Pallavicini, R., & Sanz-Forcada, J. 2006, A&A, 446, 501 [NASA ADS] [CrossRef] [EDP Sciences] [Google Scholar]
- Freedman, D., & Diaconis, P. 1981, Zeitschrift für Wahrscheinlichkeitstheorie und Verwandte Gebiete, 57, 453 [Google Scholar]
- Gaia Collaboration (Prusti, T., et al.) 2016, A&A, 595, A1 [NASA ADS] [CrossRef] [EDP Sciences] [Google Scholar]
- Gaia Collaboration (Brown, A. G. A., et al.) 2018, A&A, 616, A1 [NASA ADS] [CrossRef] [EDP Sciences] [Google Scholar]
- Garrison, R. F. 1967, PASP, 79, 433 [NASA ADS] [CrossRef] [Google Scholar]
- Goicoechea, J. R., Pety, J., Gerin, M., et al. 2006, A&A, 456, 565 [NASA ADS] [CrossRef] [EDP Sciences] [Google Scholar]
- González Hernández, J. I., Caballero, J. A., Rebolo, R., et al. 2008, A&A, 490, 1135 [NASA ADS] [CrossRef] [EDP Sciences] [Google Scholar]
- Greenstein, J. L., & Keenan, P. C. 1958, ApJ, 127, 172 [NASA ADS] [CrossRef] [Google Scholar]
- Guetter, H. H. 1981, AJ, 86, 1057 [NASA ADS] [CrossRef] [Google Scholar]
- Habart, E., Abergel, A., Walmsley, C. M., Teyssier, D., & Pety, J. 2005, A&A, 437, 177 [NASA ADS] [CrossRef] [EDP Sciences] [Google Scholar]
- Haro, G., & Moreno, A. 1953, Boletin de los Observatorios Tonantzintla y Tacubaya, 1, 11 [Google Scholar]
- Herbig, G. H. 1962, ApJ, 135, 736 [NASA ADS] [CrossRef] [Google Scholar]
- Hernández, J., Calvet, N., Hartmann, L., et al. 2005, AJ, 129, 856 [NASA ADS] [CrossRef] [Google Scholar]
- Hernández, J., Hartmann, L., Megeath, T., et al. 2007, ApJ, 662, 1067 [NASA ADS] [CrossRef] [Google Scholar]
- Hernández, J., Calvet, N., Perez, A., et al. 2014, ApJ, 794, 36 [NASA ADS] [CrossRef] [Google Scholar]
- Houk, N., & Swift, C. 1999, Michigan Catalogue of Two-dimensional Spectral Types for the HD Stars (University of Michigan), 5 [Google Scholar]
- Jeffries, R. D., Maxted, P. F. L., Oliveira, J. M., & Naylor, T. 2006, MNRAS, 371, L6 [NASA ADS] [CrossRef] [Google Scholar]
- Johnson, H. L., & Mitchell, R. I. 1958, ApJ, 128, 31 [NASA ADS] [CrossRef] [Google Scholar]
- Kenyon, M. J., Jeffries, R. D., Naylor, T., Oliveira, J. M., & Maxted, P. F. L. 2005, MNRAS, 356, 89 [NASA ADS] [CrossRef] [Google Scholar]
- Kirkpatrick, J. D., Henry, T. J., & McCarthy, Jr., D. W. 1991, ApJS, 77, 417 [NASA ADS] [CrossRef] [Google Scholar]
- Koenig, X., Hillenbrand, L. A., Padgett, D. L., & DeFelippis, D. 2015, AJ, 150, 100 [NASA ADS] [CrossRef] [Google Scholar]
- Kounkel, M., Covey, K., Suárez, G., et al. 2018, AJ, 156, 84 [NASA ADS] [CrossRef] [Google Scholar]
- Kroupa, P. 2001, MNRAS, 322, 231 [NASA ADS] [CrossRef] [Google Scholar]
- Lada, C. J., Muench, A. A., Luhman, K. L., et al. 2006, AJ, 131, 1574 [NASA ADS] [CrossRef] [Google Scholar]
- Lee, C. W., Martin, E. L., & Mathieu, R. D. 1994, AJ, 108, 1445 [NASA ADS] [CrossRef] [Google Scholar]
- Lépine, S., Hilton, E. J., Mann, A. W., et al. 2013, AJ, 145, 102 [NASA ADS] [CrossRef] [Google Scholar]
- López-Martín, L., Raga, A. C., López, J. A., & Meaburn, J. 2001, A&A, 371, 1118 [NASA ADS] [CrossRef] [EDP Sciences] [Google Scholar]
- López-Santiago, J., & Caballero, J. A. 2008, A&A, 491, 961 [NASA ADS] [CrossRef] [EDP Sciences] [Google Scholar]
- Luhman, K. L., Hernández, J., Downes, J. J., Hartmann, L., & Briceño, C. 2008, ApJ, 688, 362 [NASA ADS] [CrossRef] [Google Scholar]
- Lyngå, G. 1982, A&A, 109, 213 [NASA ADS] [Google Scholar]
- Maíz Apellániz, J., Barbá, R. H., Simón-Díaz, S., et al. 2018, A&A, 615, A161 [NASA ADS] [CrossRef] [EDP Sciences] [Google Scholar]
- Manara, C. F., Testi, L., Rigliaco, E., et al. 2013, A&A, 551, A107 [NASA ADS] [CrossRef] [EDP Sciences] [Google Scholar]
- Martín, E. L., Lodieu, N., Pavlenko, Y., & Béjar, V. J. S. 2018, ApJ, 856, 40 [NASA ADS] [CrossRef] [Google Scholar]
- Maucó, K., Hernández, J., Calvet, N., et al. 2016, ApJ, 829, 38 [NASA ADS] [CrossRef] [Google Scholar]
- Maxted, P. F. L., Jeffries, R. D., Oliveira, J. M., Naylor, T., & Jackson, R. J. 2008, MNRAS, 385, 2210 [NASA ADS] [CrossRef] [Google Scholar]
- Metodieva, Y., Antonova, A., Golev, V., et al. 2015, MNRAS, 446, 3878 [NASA ADS] [CrossRef] [Google Scholar]
- Mezger, P. G., Chini, R., Kreysa, E., Wink, J. E., & Salter, C. J. 1988, A&A, 191, 44 [NASA ADS] [Google Scholar]
- Montes, D., López-Santiago, J., Gálvez, M. C., et al. 2001a, MNRAS, 328, 45 [NASA ADS] [CrossRef] [MathSciNet] [Google Scholar]
- Montes, D., López-Santiago, J., Fernández-Figueroa, M. J., & Gálvez, M. C. 2001b, A&A, 379, 976 [NASA ADS] [CrossRef] [EDP Sciences] [Google Scholar]
- Muench, A. A., Alves, J., Lada, C. J., & Lada, E. A. 2001, ApJ, 558, L51 [NASA ADS] [CrossRef] [Google Scholar]
- Nesterov, V. V., Kuzmin, A. V., Ashimbaeva, N. T., et al. 1995, A&AS, 110, 367 [NASA ADS] [Google Scholar]
- Neuhäuser, R., Torres, G., Sterzik, M. F., & Randich, S. 1997, A&A, 325, 647 [NASA ADS] [Google Scholar]
- Newton, E. R., Charbonneau, D., Irwin, J., et al. 2014, AJ, 147, 20 [NASA ADS] [CrossRef] [Google Scholar]
- Oliveira, J. M., & van Loon, J. T. 2004, A&A, 418, 663 [NASA ADS] [CrossRef] [EDP Sciences] [Google Scholar]
- Pallavicini, R., Golub, L., Rosner, R., et al. 1981, ApJ, 248, 279 [NASA ADS] [CrossRef] [Google Scholar]
- Pecaut, M. J., & Mamajek, E. E. 2013, ApJS, 208, 9 [NASA ADS] [CrossRef] [Google Scholar]
- Peña Ramírez, K., Béjar, V. J. S., Zapatero Osorio, M. R., Petr-Gotzens, M. G., & Martín, E. L. 2012, ApJ, 754, 30 [NASA ADS] [CrossRef] [Google Scholar]
- Pérez-Blanco, A., Maucó, K., Hernández, J., et al. 2018, ApJ, 867, 116 [NASA ADS] [CrossRef] [Google Scholar]
- Péricaud, J., Di Folco, E., Dutrey, A., Guilloteau, S., & Piétu, V. 2017, A&A, 600, A62 [NASA ADS] [CrossRef] [EDP Sciences] [Google Scholar]
- Perryman, M. A. C., Brown, A. G. A., Lebreton, Y., et al. 1998, A&A, 331, 81 [NASA ADS] [Google Scholar]
- Popper, D. M. 1980, ARA&A, 18, 115 [NASA ADS] [CrossRef] [Google Scholar]
- Pound, M. W., Reipurth, B., & Bally, J. 2003, AJ, 125, 2108 [NASA ADS] [CrossRef] [Google Scholar]
- Preibisch, T., Kim, Y.-C., Favata, F., et al. 2005, ApJS, 160, 401 [NASA ADS] [CrossRef] [Google Scholar]
- Reipurth, B., Bally, J., Fesen, R. A., & Devine, D. 1998, Nature, 396, 343 [NASA ADS] [CrossRef] [Google Scholar]
- Riaz, B., Gizis, J. E., & Harvin, J. 2006, AJ, 132, 866 [NASA ADS] [CrossRef] [Google Scholar]
- Riaz, B., Briceño, C., Whelan, E. T., & Heathcote, S. 2017, ApJ, 844, 47 [NASA ADS] [CrossRef] [Google Scholar]
- Riaz, B., Machida, M. N., & Stamatellos, D. 2019, MNRAS, 486, 4114 [NASA ADS] [CrossRef] [Google Scholar]
- Sacco, G. G., Randich, S., Franciosini, E., Pallavicini, R., & Palla, F. 2007, A&A, 462, L23 [NASA ADS] [CrossRef] [EDP Sciences] [Google Scholar]
- Sacco, G. G., Franciosini, E., Randich, S., & Pallavicini, R. 2008, A&A, 488, 167 [NASA ADS] [CrossRef] [EDP Sciences] [Google Scholar]
- Sánchez-Blázquez, P., Peletier, R. F., Jiménez-Vicente, J., et al. 2006, MNRAS, 371, 703 [NASA ADS] [CrossRef] [Google Scholar]
- Schaefer, G. H., Hummel, C. A., Gies, D. R., et al. 2016, AJ, 152, 213 [NASA ADS] [CrossRef] [Google Scholar]
- Sherry, W. H., Walter, F. M., & Wolk, S. J. 2004, AJ, 128, 2316 [NASA ADS] [CrossRef] [Google Scholar]
- Sherry, W. H., Walter, F. M., Wolk, S. J., & Adams, N. R. 2008, AJ, 135, 1616 [NASA ADS] [CrossRef] [Google Scholar]
- Simón-Díaz, S., Caballero, J. A., & Lorenzo, J. 2011, ApJ, 742, 55 [NASA ADS] [CrossRef] [Google Scholar]
- Simón-Díaz, S., Caballero, J. A., Lorenzo, J., et al. 2015, ApJ, 799, 169 [NASA ADS] [CrossRef] [Google Scholar]
- Skinner, S. L., Sokal, K. R., Cohen, D. H., et al. 2008, ApJ, 683, 796 [NASA ADS] [CrossRef] [Google Scholar]
- Skrutskie, M. F., Cutri, R. M., Stiening, R., et al. 2006, AJ, 131, 1163 [NASA ADS] [CrossRef] [Google Scholar]
- Soderblom, D. R., Jones, B. F., Balachandran, S., et al. 1993, AJ, 106, 1059 [NASA ADS] [CrossRef] [Google Scholar]
- Soderblom, D. R., Hillenbrand, L. A., Jeffries, R. D., Mamajek, E. E., & Naylor, T. 2014, in Protostars and Planets VI, eds. H. Beuther, R. S. Klessen, C. P. Dullemond, & T. Henning, 219 [Google Scholar]
- Stauffer, J. R., & Hartmann, L. W. 1986, ApJS, 61, 531 [NASA ADS] [CrossRef] [Google Scholar]
- Stauffer, J. R., Schultz, G., & Kirkpatrick, J. D. 1998, ApJ, 499, L199 [NASA ADS] [CrossRef] [Google Scholar]
- Stelzer, B., & Neuhäuser, R. 2001, A&A, 377, 538 [NASA ADS] [CrossRef] [EDP Sciences] [Google Scholar]
- Turner, N. H., ten Brummelaar, T. A., Roberts, L. C., et al. 2008, AJ, 136, 554 [NASA ADS] [CrossRef] [Google Scholar]
- van Altena, W. F., Lee, J. T., & Hoffleit, E. D. 1995, The General Catalogue of Trigonometric Stellar Parallaxes (New Haven, CT: Yale University Observatory) [Google Scholar]
- Vandenberg, D. A., & Bridges, T. J. 1984, ApJ, 278, 679 [NASA ADS] [CrossRef] [Google Scholar]
- van Leeuwen, F. 2007, A&A, 474, 653 [NASA ADS] [CrossRef] [EDP Sciences] [Google Scholar]
- Vazdekis, A., Sánchez-Blázquez, P., Falcón-Barroso, J., et al. 2010, MNRAS, 404, 1639 [NASA ADS] [Google Scholar]
- Walter, F. M., Sherry, W. H., Wolk, S. J., & Adams, N. R. 2008, Handbook of Star Forming Regions, 4, 732 [NASA ADS] [Google Scholar]
- Warren, W. H., & Hesser, J. E. 1977, ApJS, 34, 115 [NASA ADS] [CrossRef] [Google Scholar]
- Williams, J. P., Cieza, L. A., Andrews, S. M., et al. 2013, MNRAS, 435, 1671 [NASA ADS] [CrossRef] [Google Scholar]
- Winter, A. J., Clarke, C. J., Rosotti, G., et al. 2018, MNRAS, 478, 2700 [NASA ADS] [CrossRef] [Google Scholar]
- Wolk, S. J. 1996, PhD Thesis, Harvard-Smithsonian Center for Astrophysics Cambridge, Massachusetts, USA [Google Scholar]
- Zacharias, N., Monet, D. G., Levine, S. E., et al. 2005, VizieR Online Data Catalog: I/297 [Google Scholar]
- Zapatero Osorio, M. R., Béjar, V. J. S., Martín, E. L., et al. 2000, Science, 290, 103 [NASA ADS] [CrossRef] [PubMed] [Google Scholar]
- Zapatero Osorio, M. R., Béjar, V. J. S., Pavlenko, Y., et al. 2002, A&A, 384, 937 [NASA ADS] [CrossRef] [EDP Sciences] [Google Scholar]
- Zapatero Osorio, M. R., Béjar, V. J. S., & Peña Ramírez, K. 2017, ApJ, 842, 65 [NASA ADS] [CrossRef] [Google Scholar]
Appendix A: Large-format figures and long tables
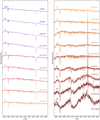 |
Fig. A.1. R1200Y IDS/INT spectra of 18 stars (most from σ Orionis) with spectral types from O9.5+ V to M6 in the wavelength range used for spectral-type identification. |
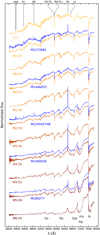 |
Fig. A.2. OSIRIS/GTC normalised spectra of five of the σ Orionis stars of different spectral types (in blue) on a grid of spectra of standard stars used for visual spectral-type identification of the OSIRIS spectra. The main spectral lines and most relevant absorption bands are also marked. |
Observations of targets towards σ Orionis with IDS/INT.
Observations of targets towards σ Orionis with OSIRIS/GTC.
Equivalent widths of IDS/INT spectra of stars and brown dwarfs towards σ Orionis.
Equivalent widths of OSIRIS/GTC spectra of stars and brown dwarfs towards σ Orionis.
Membership and youth features of investigated stars (a).
All Tables
Equivalent widths of IDS/INT spectra of stars and brown dwarfs towards σ Orionis.
Equivalent widths of OSIRIS/GTC spectra of stars and brown dwarfs towards σ Orionis.
All Figures
|
Fig. 1. Literature and adopted spectral types. Red filled circles and blue crosses stand for cluster members and non-members, respectively. Literature spectral types were retrieved from Greenstein & Keenan (1958), Guetter (1981), Nesterov et al. (1995), Wolk (1996), Houk & Swift (1999), Zapatero Osorio et al. (2002), Sacco et al. (2008), Caballero et al. (2008, 2012), Manara et al. (2013), and Hernández et al. (2014). The G7 star previously classified as A0 is “IDS 05335–0238 D”; the early spectral type may actually correspond to a close-by early A star at a few arcseconds (Hernández et al. 2014). The F7 star previously classified as K0 is Mayrit 968292; the late-G/early-K estimation from photometry by Caballero (2008a) was incorrect. |
| In the text | |
|
Fig. 2. Histograms of Gaia DR2 total proper motions (top) and parallaxes (bottom). Vertical dashed lines indicate the conservative σ Orionis boundary limits explained in Sect. 3.1. The bin sizes of these histograms have been adjusted according to Freedman & Diaconis (1981). |
| In the text | |
|
Fig. 3. Measured Li I EWs as a function of adopted spectral type. Filled red circles show young targets observed with IDS R1200Y; open red circles show young targets observed with IDS R150V (controvertible); filled orange circles show young targets observed with OSIRIS R100B; blue crosses show non-member stars with Li I (Haro 5-17 and Haro 5-46); solid magenta lines show upper and lower EW(Li I) envelopes of the Pleiades (τ ∼ 120 Ma – Soderblom et al. 1993; Montes et al. 2001b); and the dashed cyan line shows the upper EW(Li I) envelope of IC 2602 (τ ∼ 30 Ma – Neuhäuser et al. 1997). |
| In the text | |
|
Fig. 4. Histogram of the number of sources as a function of the measured EW(Hα). The bin size of this histogram has been adjusted according to Freedman & Diaconis (1981). |
| In the text | |
|
Fig. 5. Measured EW(Hα) of our sample of stars as a function of adopted spectral type. The black dashed line shows the curve fitting from K0 to L0 of the EWs used in Barrado y Navascués & Martín (2003) as an empirical criterion for identifying classical T Tauri stars. The black dotted line shows the coarse extrapolation of the Barrado y Navascués & Martín (2003) criterion to spectral types earlier than K0 (EW(Hα) = –3.9 Å). Big and small red filled circles indicate cluster member stars and brown dwarfs with EWs above and below the black lines, respectively. Big and small blue crosses show non-cluster-member stars with EWs above and below the black lines, respectively. The early K-type σ Orionis star with strong emission is Mayrit 871071 (Haro 5-27, V510 Ori), the driving source of the jet HH 444 (Reipurth et al. 1998; López-Martín et al. 2001). |
| In the text | |
|
Fig. 6. Normalised spectra around Hα λ6562.80 Å of the 14 strong accretors in Table 4. The vertical lines show the Hα line shifted by –2.5 Å (cyan), 0.0 Å (black), and +2.5 Å (red). |
| In the text | |
|
Fig. 7. Gaia DR2 radial velocity as a function of adopted spectral type. Red and blue circles highlight σ Orionis stars and non-cluster-member stars, respectively; coloured vertical error bars show 3σ uncertainties; and the black horizontal line shows the σ Ori systemic velocity γ = +31.10 ± 0.16 km s−1. |
| In the text | |
|
Fig. A.1. R1200Y IDS/INT spectra of 18 stars (most from σ Orionis) with spectral types from O9.5+ V to M6 in the wavelength range used for spectral-type identification. |
| In the text | |
|
Fig. A.2. OSIRIS/GTC normalised spectra of five of the σ Orionis stars of different spectral types (in blue) on a grid of spectra of standard stars used for visual spectral-type identification of the OSIRIS spectra. The main spectral lines and most relevant absorption bands are also marked. |
| In the text | |
Current usage metrics show cumulative count of Article Views (full-text article views including HTML views, PDF and ePub downloads, according to the available data) and Abstracts Views on Vision4Press platform.
Data correspond to usage on the plateform after 2015. The current usage metrics is available 48-96 hours after online publication and is updated daily on week days.
Initial download of the metrics may take a while.