Free Access
Fig. 6.
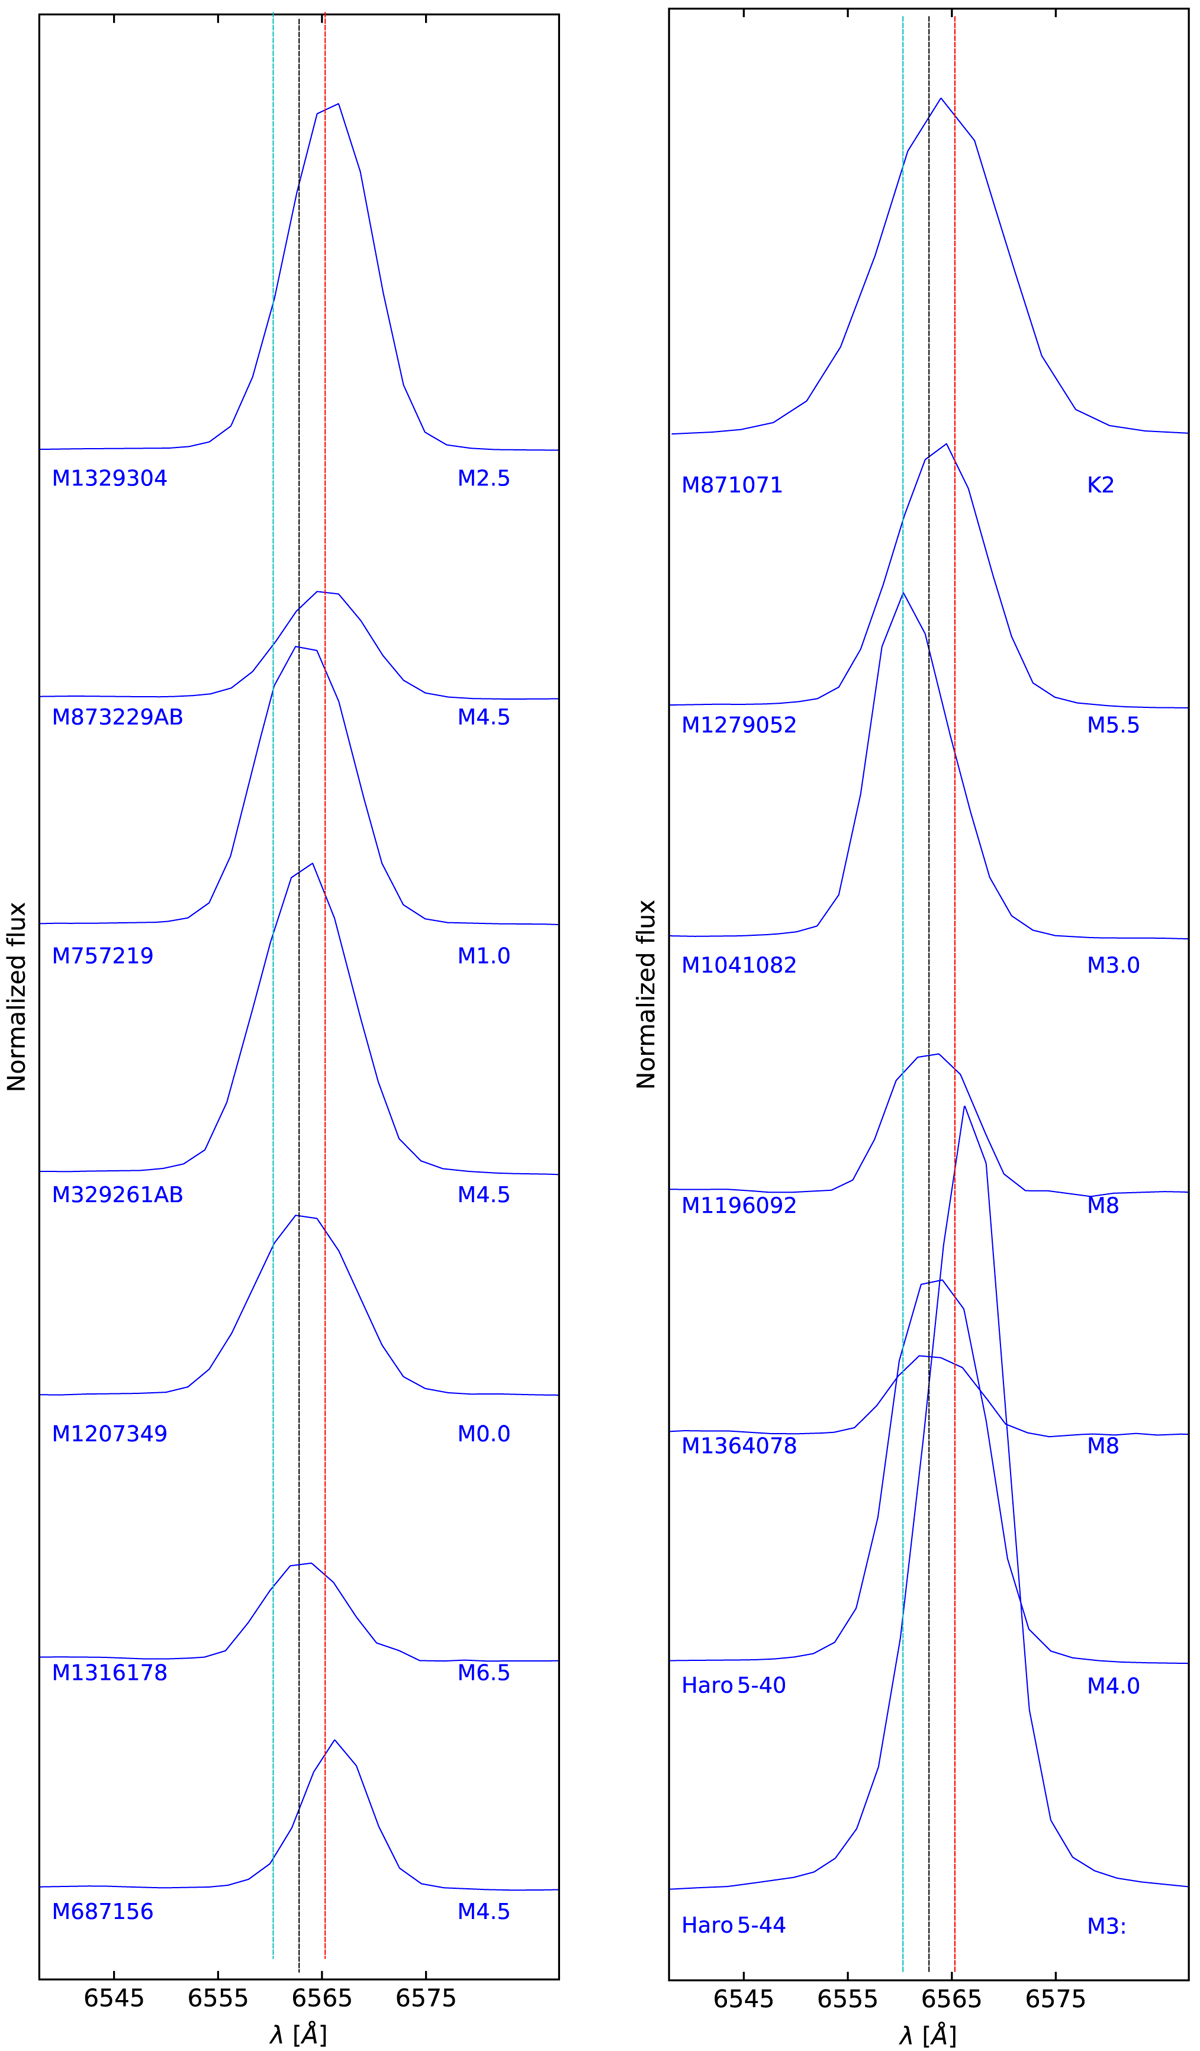
Normalised spectra around Hα λ6562.80 Å of the 14 strong accretors in Table 4. The vertical lines show the Hα line shifted by –2.5 Å (cyan), 0.0 Å (black), and +2.5 Å (red).
Current usage metrics show cumulative count of Article Views (full-text article views including HTML views, PDF and ePub downloads, according to the available data) and Abstracts Views on Vision4Press platform.
Data correspond to usage on the plateform after 2015. The current usage metrics is available 48-96 hours after online publication and is updated daily on week days.
Initial download of the metrics may take a while.