Free Access
Fig. 2.
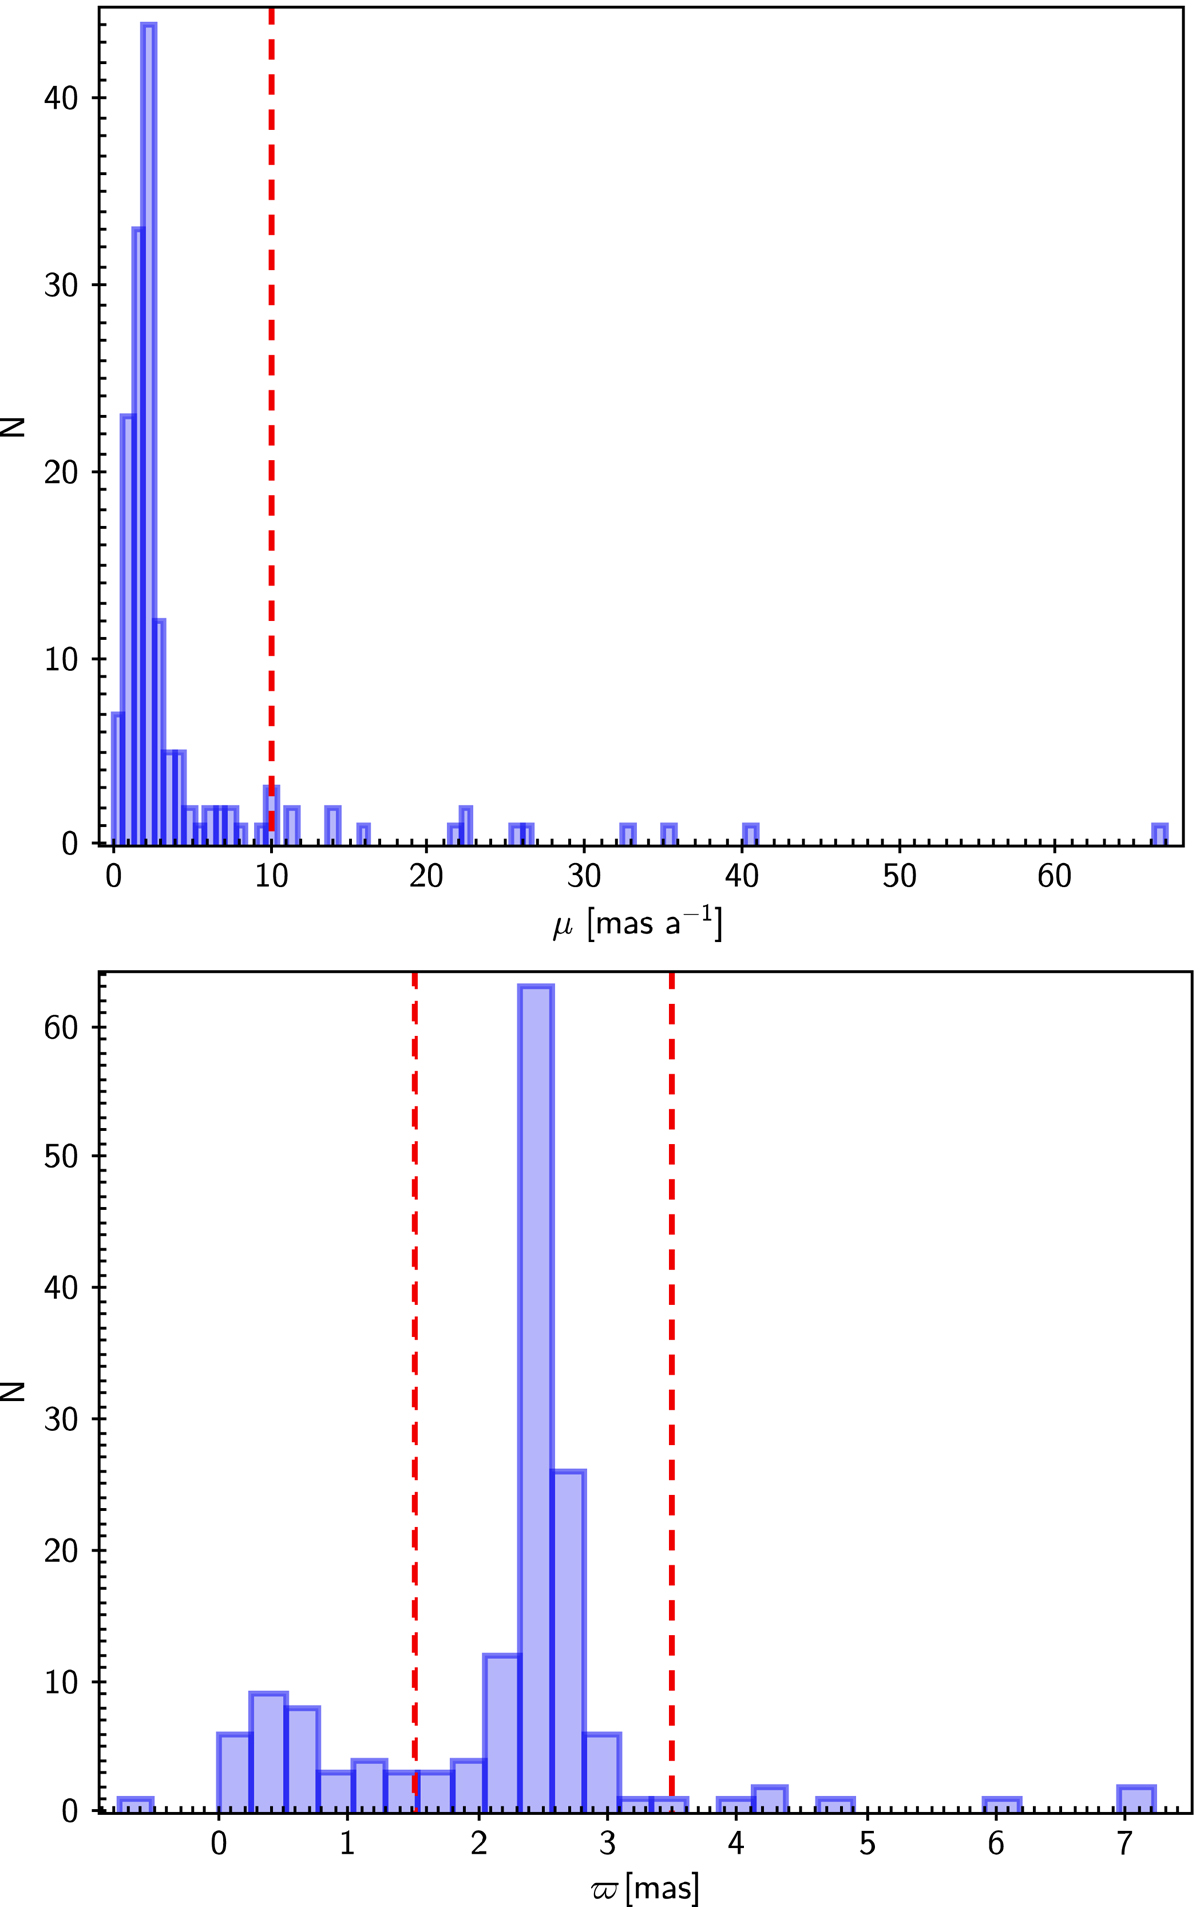
Histograms of Gaia DR2 total proper motions (top) and parallaxes (bottom). Vertical dashed lines indicate the conservative σ Orionis boundary limits explained in Sect. 3.1. The bin sizes of these histograms have been adjusted according to Freedman & Diaconis (1981).
Current usage metrics show cumulative count of Article Views (full-text article views including HTML views, PDF and ePub downloads, according to the available data) and Abstracts Views on Vision4Press platform.
Data correspond to usage on the plateform after 2015. The current usage metrics is available 48-96 hours after online publication and is updated daily on week days.
Initial download of the metrics may take a while.