| Issue |
A&A
Volume 629, September 2019
|
|
|---|---|---|
| Article Number | A110 | |
| Number of page(s) | 7 | |
| Section | Planets and planetary systems | |
| DOI | https://doi.org/10.1051/0004-6361/201935979 | |
| Published online | 12 September 2019 | |
He I λ 10 830 Å in the transmission spectrum of HD209458 b
1
Leiden Observatory, Leiden University,
Postbus 9513,
2300 RA
Leiden,
The Netherlands
e-mail: alonso@strw.leidenuniv.nl
2
Hamburger Sternwarte, Universität Hamburg,
Gojenbergsweg 112,
21029 Hamburg,
Germany
3
Instituto de Astrofísica de Andalucía (IAA-CSIC),
Glorieta de la Astronomía s/n,
18008 Granada,
Spain
4
Instituto de Astrofísica de Canarias (IAC),
Calle Vía Lactea s/n,
38200 La Laguna,
Tenerife,
Spain
5
Departamento de Astrofísica, Universidad de La Laguna,
38026 La Laguna,
Tenerife,
Spain
6
Centro de Astrobiología (CSIC-INTA), ESAC, Camino bajo del castillo s/n,
28692
Villanueva de la Cañada,
Madrid,
Spain
7
Institut für Astrophysik, Georg-August-Universität,
37077 Göttingen,
Germany
8
Institut de Ciències de l’Espai (CSIC-IEEC),
Campus UAB, c/ de Can Magrans s/n,
08193 Bellaterra,
Barcelona,
Spain
9
Institut d’Estudis Espacials de Catalunya (IEEC),
08034 Barcelona,
Spain
10
Landessternwarte, Zentrum für Astronomie der Universität Heidelberg,
Königstuhl 12,
69117 Heidelberg,
Germany
11
Centro Astronónomico Hispano Alemán, Observatorio de Calar Alto, Sierra de los Filabres,
04550 Gérgal,
Spain
12
School of Physics and Astronomy, Queen Mary, University of London,
327 Mile End Road,
London,
E1 4NS,
UK
13
Thüringer Landessternwarte Tautenburg,
Sternwarte 5,
07778 Tautenburg,
Germany
14
Max-Planck-Institut für Astronomie,
Königstuhl 17,
69117 Heidelberg,
Germany
15
Departamento de Física de la Tierra y Astrofísica and IPARCOS-UCM (Intituto de Física de Partículas y del Cosmos de la UCM), Facultad de Ciencias Físicas, Universidad Complutense de Madrid,
28040
Madrid,
Spain
16
Centro de Astrobiología (CSIC-INTA),
Carretera de Ajalvir km 4,
28850 Torrejón de Ardoz,
Madrid,
Spain
Received:
29
May
2019
Accepted:
2
August
2019
Context. Recently, the He I triplet at 10 830 Å was rediscovered as an excellent probe of the extended and possibly evaporating atmospheres of close-in transiting planets. This has already resulted in detections of this triplet in the atmospheres of a handful of planets, both from space and from the ground. However, while a strong signal is expected for the hot Jupiter HD 209458 b, only upper limits have been obtained so far.
Aims. Our goal is to measure the helium excess absorption from HD 209458 b and assess the extended atmosphere of the planet and possible evaporation.
Methods. We obtained new high-resolution spectral transit time-series of HD 209458 b using CARMENES at the 3.5 m Calar Alto telescope, targeting the He I triplet at 10 830 Å at a spectral resolving power of 80 400. The observed spectra were corrected for stellar absorption lines using out-of-transit data, for telluric absorption using the MOLECFIT software, and for the sky emission lines using simultaneous sky measurements through a second fibre.
Results. We detect He I absorption at a level of 0.91 ± 0.10% (9 σ) at mid-transit. The absorption follows the radial velocity change of the planet during transit, unambiguously identifying the planet as the source of the absorption. The core of the absorption exhibits a net blueshift of 1.8 ± 1.3 km s−1. Possible low-level excess absorption is seen further blueward from the main absorption near the centre of the transit, which could be caused by an extended tail. However, this needs to be confirmed.
Conclusions. Our results further support a close relation between the strength of planetary absorption in the helium triplet lines and the level of ionising, stellar X-ray, and extreme-UV irradiation.
Key words: planets and satellites: atmospheres / planets and satellites: individual: HD 209458 b / techniques: spectroscopic / infrared: planetary systems
© ESO 2019
1 Introduction
Atmospheric mass loss can have a profound influence on the evolution of a planet, including the early evolution of the Earth (Lammer et al. 2008) and other solar system planets. Hot Jupiters, gas giants in tight orbits, are ideal objects to study atmospheric mass loss in detail. A large, extended atmosphere was first detected around HD 209458 b targeting the Lyα line (Vidal-Madjar et al. 2003), showing a deep transit signal pointing at atmospheric escape. While the extended atmosphere around this planet was subsequently also detected in carbon and oxygen (Vidal-Madjar et al. 2004), Lyα has remained a primary tool to study planetary atmospheres and their escape (e.g. Lecavelier des Etangs et al. 2010; Kulow et al. 2014; Ehrenreich et al. 2015; Lavie et al. 2017; Bourrier et al. 2017, 2018). Most notably, Ehrenreich et al. (2015) and later Lavie et al. (2017) showed that the hot Neptune GJ 436 b is surrounded by a giant comet-like cloud of hydrogen, extending far beyond the Roche radius.
Unfortunately, Lyα is located in the ultraviolet part of the spectrum and currently only accessible using the Hubble Space Telescope (HST). Furthermore, observations are strongly hampered by interstellar absorption and air glow emission originating from a halo of hydrogen atoms around the Earth, contaminating the profile of the Lyα line. Almost two decades ago, Seager & Sasselov (2000) proposed the He I transition at 10 830 Å (in air), a triplet of absorption lines of a metastable state of helium, as a good candidate to study the extended atmospheres of close-in giant planets. Moutou et al. (2003) studied this helium transition during a transit of HD 209458 b – observed with the spectroscopic mode of ISAAC on the VLT – and obtained a 3σ upper limit of 0.5% for a 3 Å bandwidth.
Recently, three independent groups detected He I λ 10 830 Å in exoplanetatmospheres. Spake et al. (2018) detected the triplet in WASP-107 b using spectrophotometry with HST/WFC3. Spectroscopic detections at high-resolution were made in WASP-69 b, HAT-P-11 b, and HD 189733 b (Nortmann et al. 2018; Allart et al. 2018; Salz et al. 2018, of 3.59 ± 0.19%, ~1.2 ± 0.2%1, and 1.04 ± 0.09%, maximum reached absorptions respec- tively). Another spectrophotometrical detection with HST/ WFC3 was later made in HAT-P-11 b (Mansfield et al. 2018) and ground spectroscopic observations of WASP-107 b (Allart et al. 2019, 7.92 ± 1.00%) confirmed the earlier HST detection and revealed detailed information on the helium escape as being in the form of a cometary-like tail.
The ground-based measurements are particularly informative, since they are conducted using high-dispersion spectroscopy – in all four cases with the CARMENES spectrograph on the 3.5 m Calar-Alto Telescope (Quirrenbach et al. 2016, 2018). At a resolving power of 80 400, details on the radial velocity distribution of the helium gas are available. For example, Nortmann et al. (2018) measured blueshifts of several kilometres per second, which in combination with post-transit absorption, was interpreted as the escape of part of the atmosphere trailing behind the planet in comet-like form.
Nortmann et al. (2018) also provided He I upper limits for three additional planets, HD 209458 b, Kelt-9 b, and GJ 436 b, of 0.84, 0.33, and 0.41%, respectively (90% confidence limits). The wide range of He I absorption levels found for close-in planets is likely linked to the level of stellar X-ray and extreme-UV (5–504 Å) irradiation of the host star, populating the metastable 23 S helium triple state (Nortmann et al. 2018). A similar relation between the He triplet and ionizing XUV (λ < 504 Å) radiation was previously observed in stellar coronae (e.g. Sanz-Forcada & Dupree 2008).
The observations presented in Nortmann et al. (2018) for HD 209458 b were performed under sub-optimal conditions, resulting in poor data quality that hampered the search for helium (see Sect. 4). In this work, we present new CARMENES transit observations targeting the He I λ 10 830 Å triplet, now resulting in a firm detection at 0.91 ± 0.10%. In Sect. 2 we present the observations, in Sect. 3 the data analysis, in Sect. 4 the discussion on the results, and we conclude in Sect. 5.
2 Observations
We observed the system HD 209458 with CARMENES on 5 September 20182. The planet is an archetypal hot Jupiter, and the first known transiting system of its kind (Charbonneau et al. 2000; Henry et al. 2000; Table 1). As a bright nearby system, it has been the subject of many observational studies targeting its transmission spectrum (e.g. Charbonneau et al. 2002; Deming et al. 2005b; Snellen et al. 2008, 2010; Hoeijmakers et al. 2015; Hawker et al. 2018), its hydrogen upper atmosphere (Vidal-Madjar et al. 2003; Ben-Jaffel 2007; Ehrenreich et al. 2008), and its emission spectrum (Deming et al. 2005a; Knutson et al. 2008; Swain et al. 2009; Schwarz et al. 2015; Brogi et al. 2017). This makes it one of the best-studied exoplanets and a benchmark for atmospheric evaporation modelling.
CARMENES consists of two spectrograph channels fed by fibres connected to the front-end mounted on the telescope. One of the CARMENES spectrographs, dubbed VIS channel, covers the optical wavelength range Δλ = 520–960 nm over 55 orders. The other spectrograph, the near-infrared (NIR) channel, covers the wavelength range Δλ = 960–1710 nm over 28 orders. The resolving power is  = 94 600 in the VIS channel and
  = 80 400 in the NIR channel. Two fibres are connected to each channel: fibre A is used for the target, and fibre B for the sky. The observations were obtained in service mode and consisted of 91 exposures of 198 s, starting at 21:39 UT and ending at 03:47 UT on the night starting on 5 September 2018, corresponding to a planet orbital phase range of ϕ = –0.036 to +0.037. The tracking of the target was lost during the pre-transit phase from 22:12 UT to 22:39 UT (ϕ = –0.029 to –0.024, Fig. 1). We did not include these spectra in our analysis. A typical continuum signal-to-noise ratio (S/N) of ~95 per spectrum was reached around the He I triplet. Since the quality of the data decreased significantly during the post-transit, down to a S/N of ~40–60, we also discarded the last eight spectra (from 03:14 UT onward).
During the observing run, the airmass ranged between 1.05 and 2.11. We regularly updated the atmospheric dispersion corrector, requiring a re-acquisition of the target, each time taking about two minutes (cf. Seifert et al. 2012). The update was done every ~40 min when the target was observed at altitudes >70° (airmass <1.06), every ~30 min at altitudes between 70° and 50° (airmass 1.06–1.30), and every ~15 min at lower altitudes (airmass >1.30). During the course of the observation, the column of precipitable water vapour (PWV) towards the target (measured from the spectra) decreased from 10.3 to 3.8 mm.
Parameters of the exoplanet system HD 209458.
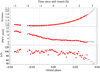 |
Fig. 1 Change in airmass (top), precipitable water vapour (middle), and signal-to-noise ratio (bottom) during observations (mid-transit ~00:39 UT). Vertical dashed lines indicate the first, second, third, and fourth contact, respectively. The lack of data around −2.3 h was due to a loss in the tracking system. The post-transit observations not included in the analysis are shown in grey. The out-of-transit red diamonds were used to compute the master spectrum of Fig. 2. |
3 Data analysis and results
The observed spectra were reduced using the CARMENES pipeline CARACAL v2.10 (Zechmeister et al. 2014; Caballero et al. 2016). The pipeline provides a vacuum wavelength solution, which we converted into air wavelengths, as used in the remainder of the paper.
The standard bad pixels mask of the NIR detector included in CARACAL v2.10 did not sufficiently correct for hot pixel effects. In the data of fibre B, we included in the mask the left and right neighbours around the hot pixels in the dispersion direction of the detector, while in fibre A we also included the top and bottom neighbours. A pair of remaining bad pixels present in the extracted spectra were removed manually (pixels 482 and 489 corresponding to 10 829.357 and 10 829.757 Å). In one of the observed spectra, taken at 00:13:58 UT, irregular variations in the continuum were recorded for some orders. However, they did not affect the spectral order containing the He I triplet.
Subsequently, a similar process as in Nortmann et al. (2018) and Salz et al. (2018) was followed to remove the stellar and telluric absorption and the sky emission lines from the spectra around the He I triplet. We used version 1.5.9 of the MOLECFIT software (Smette et al. 2015; Kausch et al. 2015) to remove the telluric absorption lines. However, as explained by Shulyak et al. (2019), the telluric removal depends strongly on the S/N of the data and atmospheric humidity, which might cause artefacts in the core of the telluric lines after correction. Therefore, the cores of the telluric lines could not be adequately corrected, and these regions were masked out (see Figs. 2 and 3). We subtracted the sky emission lines using the sky spectra from fibre B as explained in Salz et al. (2018). The fibre B spectra were extracted inthe same way as those of fibre A and were corrected for cosmic rays by fitting the temporal variation of each wavelength element with a high-order polynomial, and substituting those values that deviate by more than 5σ.
We then normalised the stellar spectra by fitting their continuum, removing the cosmic-rays as in fibre B, and shifting the spectra to the stellar rest-frame using the barycentric and systemic velocities. A master spectrum was created (Fig. 2) combining the out-of-transit spectra with weights at each wavelength step based on the S/N following 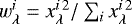 , where xλ is the S/N at the wavelength, and i is the consecutive number of the spectrum. Subsequently, each normalised spectrum was divided by the master spectrum, resulting in an array of residuals (wavelength vs. time) shown in Fig. 3.
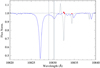 |
Fig. 2 Master spectrum in the vicinity of the He I triplet (blue line). The vertical lines indicate the positions of the three He I lines. The grey line indicates the average telluric absorption spectrum and the sky emission lines removed from the data. The latter were highly variable during the night. The masked cores of telluric absorption lines in Fig. 3 are indicated by thicker red lines. The stellar line blueward from the He triplet is Si I. |
 |
Fig. 3 Time sequence of the residual spectra around the He I triplet, after removal of the stellar and telluric absorption and the sky emission lines, with the relative flux indicated in greyscale. The radial velocity in the stellar rest-frame is on the horizontal axis, and orbital phase on the vertical axis. The corresponding wavelengths in the rest-frame of the star are indicated in the top axis. The area around orbital phase −0.03 is blanked out due to the lack of observations. The horizontal dashed lines indicate the first, second, third, and fourth contact of the transit, respectively. A helium signal is visible (darker greyscales), following the planet velocity (slanted lines) from −16 to +16 km s−1. |
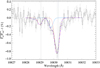 |
Fig. 4 Average transmission spectrum around the He I triplet in the planet rest-frame. The positions of the three helium lines are marked by vertical lines. The red curve is the best-fit Parker wind model obtained for a temperature of 6000 K and a mass-loss rate of 4.2 × 10⁹ g s−1. The blue line indicates a model for a tentative blueward component centred at around −13 km s−1. The magenta dashed curve is the combination of the red and blue lines. |
3.1 Transmission spectrum and light curve
Figure 3 shows the time sequence of the residual spectra around the He I triplet after removal of the stellar and telluric absorption and the sky emission lines. A helium signal is visible during transit following the planet radial velocity. This provides strong evidence that the helium absorption has a planetary origin. In the spectra obtained during mid-transit, a tentative extra absorption feature is visible directly blueward from the main helium absorption, which we discuss below. The vertical features redward of He I (60 and 120 km s−1) are masked areas corresponding to the centres of strong, highly variable telluric lines. Residuals blueward (−80 km s−1) from He I are from stellar Si I (Fig. 2) and possibly caused by the Rossiter-McLaughlin effect (see Sect. 4.1).
We shifted the residual spectra into the planet rest-frame and computed the average transmission spectrum of HD 209458 b using the 33 spectra collected between the second and third contact of the transit (ϕ = –0.013 to +0.013, Fig. 4). The peak value of the average absorption signal in the core of the two strongest and blended lines of the He I triplet was at the level of 0.91 ± 0.10%. The average absorption level over a bandwidth of 0.30 Å centred at the absorption peak was 0.71 ± 0.06%. In both cases, the absorption values and uncertainties were determined using the bootstrap method (Fig. 5) as in Salz et al. (2018). The third and weakest line of the triplet is not detected (see below). The shape of the signal shows an asymmetry on the blue side, which can also be seen at mid-transit in the two-dimensional array of Fig. 3. We further discuss the transmission line profile in Sect. 4.1.
We measure the peak of the helium absorption to be blueshifted by 1.8 ± 1.3 km s−1 with respect to the rest frame of the planet. This is compatible with the blueshift of 2 ± 1 km s−1 observed forcarbon monoxide by Snellen et al. (2010). However, this absorption likely originates in a different layer in the atmosphere of the planet.
We constructed the light curve of the He I signal by measuring the average absorption per spectrum between –13.3 and +12.0 km s−1 (i.e. between 10 829.814 and 10 830.729 Å) in the planet rest-frame, which is shown in Fig. 6. The average in-transit absorption signal was ~0.44%, about a factor two smaller than the peak transmission signal as shown in Fig. 4 due to the relatively wide integration band. There is no evidence for a pre- or post-transit absorption signal.
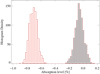 |
Fig. 5 Histograms of the mean absorption levels in the average transmission spectra generated in our bootstrap analysis when considering only spectra between the second and third contact (left) and a control sample including only the out-of-transit observations (right). |
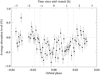 |
Fig. 6 Light curve of the He I absorption centred on the observed core of the line and using a width of Δλ ~ 0.9 Å (total Δv = 25.3 km s−1). Vertical dashed lines indicate the first, second, third, and fourth contact, respectively. There is no evidence for any out-of-transit absorption. |
3.2 Modelling of the helium triplet absorption
A one-dimensional isothermal hydrodynamic and spherically symmetric model was used to calculate the He 23S density in the planet upper atmosphere, similar to that developed by Oklopčić & Hirata (2018). For a given range of temperatures and mass-loss rates (Ṁ, where it refers to the total hydrogen and helium mass loss), the radial density and velocity profiles were computed by means of anisothermal Parker wind model (Parker 1958). The continuity equations were then solved to derive the He 23S density profile. The He triplet absorption was subsequently computed with the radiative transfer according to the primary transit geometry (Ehrenreich et al. 2006). The absorption coefficients and wavelengths for the three helium metastable lines were taken from the NIST Atomic Spectra Database3. Doppler lineshapes were assumed at the temperature of the helium model density. Additional broadening by the turbulent velocity wasnot included as we found that most of the absorption comes from radii smaller than the Roche lobe (4.22 RP), where turbulence is not expected to be important. A mean velocity of the gas along the line of sight (towards the observer) was also included in order to account for a possible bulk motion of the absorbing gas.
Figure 4 shows that the observed absorption can be well reproduced for the helium triplet density obtained from that model for a temperature of 6000 K and a mass-loss rate of 4.2 × 10⁹ g s−1 (red curve). The mean molecular weight obtained from the model for that fit is 0.76 amu. However, a degeneracy exists between the atmospheric temperatureand Ṁ in the model, meaning that Ṁ ranges between about 108 and 1011 g s−1 for temperatures of 4500–11 500 K, respectively. With all due caution, these evaporation rates – assuming a 90% H and 10% He atmosphere – are similar to previous estimations of hydrogen escape based on Lyα observations(e.g. Vidal-Madjar et al. 2003; Koskinen et al. 2010; Bourrier & Lecavelier des Etangs 2013), or energy-limited escape (Sanz-Forcada et al. 2011; Czesla et al. 2017), which is reasonable as the atmosphere is assumed to be hydrogen dominated. In addition, the model shows that the weakest component of the triplet is expected at around 1σ level, and therefore its non-detection is consistent with the given data quality. More details on the modelling and on the temperature and mass-loss rates results will be given in a future paper.
4 Discussion
Strong absorption of the upper atmosphere has previously been detected in the transmission spectrum of HD 209458 b in Lyα (Vidal-Madjar et al. 2003), atomic carbon and oxygen (Vidal-Madjar et al. 2004), and magnesium (Vidal-Madjar et al. 2013) at the 5–10% level. The He I absorption presented in this work is significantly lower, as expected due to the low fraction of helium atoms in the excited state required to produce the absorption line (Sect. 4.2). However, the mass-loss rates derived from our He I analysis agree with those obtained from Lyα (see Sect. 3.2).
Previous observations by Moutou et al. (2003) and Nortmann et al. (2018) provided upper limits on the detection of He I for HD 209458 b, and are consistent with the result presented here. Moutou et al. (2003) derived an upper limit of 0.5% for a 3 Å bandwidth. Assuming this bandwidth, our He I absorption detection (0.91 ± 0.10%, FWHM ~ 0.4 Å) corresponds to a value of 0.12%. In the case of Nortmann et al., the study of helium absorption was hampered by poor-quality data. The two datasets used in the analyses of this latter author exhibit significantly lower S/Ns than our observations. Their data were obtained with the same instrument, but this was before an extensive interventionof the NIR channel in November 2016, which improved the thermal management of the channel (Quirrenbach et al. 2018) and led to a significant improvement in the achievable data quality. In addition, the observational settings were not optimal, that is the atmospheric dispersion corrector was not properly updated and calibration images were obtained during transit resulting in a ~30% loss of signal for one of the nights. Nonetheless, the data of both nights showed hints of absorption at the He I position (see panels C and D in their Fig. S10), for which Nortmann et al. (2018) retrieved an upper limit of 0.84% (90% confidence level).
If the helium signal were to be pursued with WFC3 on the HST, its spectral resolution of 98 Å would result in a transmissionsignal of ~10 ppm. Even with NIRSPEC (Dorner et al. 2016) on the soon-to-be-launched James Webb Space Telescope (JWST), this signal will only be at the ~300 ppm level over one resolution element, at the highest resolving power ( ~ 2700).
4.1 Transmission line profile
One possible source of interference with the planetary He I absorption could be the Rossiter-McLaughlin effect (RME). However, this effect can be neglected as the stellar He I is very weak in HD 209458. In fact, for similar targets where the stellar helium is stronger, the RME is estimated to be smaller than 0.1% (e.g. Nortmann et al. 2018; Salz et al. 2018). In addition, the nearby Si I line at ~10 827 Å is almost nine times deeper than the He I feature and leaves residuals in the average transmission spectrum of 0.2–0.4%. Thus, we estimated that the maximum interference in the planetary He I absorption caused by the RME should be smaller than 0.044% (i.e. 20 times smaller than the measured transmission signal).
Around mid-transit, we noted a possible additional absorption feature about 10–15 km s−1 blueward from the main absorption (Fig. 4). We measured in the HD 209458 spectra several activity indicators related to Ca II (infrared triplet), Na, and Hα using the program STARMOD (Montes et al. 2000). There is no indication that HD 209458 happened to be in a higher state of activity than reported in the literature at any moment during the observations (e.g. Czesla et al. 2017). Therefore, a possible activity impact on the transmission spectrum is unlikely to explain the additional absorption.
We cannot exclude that this particular absorption component is an artefact due to an unsatisfactory correction of an OH-doubletof sky emission lines at ~10 830 Å (Fig. 2), but no such effect is seen for the significantly brighter OH-emission line at 10 832 Å. Alternatively, the presence of bad pixels in the area, in particular on the blue side of the main He I component, could also be responsible for the extra absorption. In addition to using the standard bad pixel mask, we developed a method to identify and correct bad pixels more carefully (see Sect. 3). This did not significantly reduce the possible absorption feature on the blue side of the main helium signal either.
If real, the signal can be fitted by an extra absorption component in the average transmission spectrum from which a bulk velocity shift of −13 km s−1 can be estimated (Fig. 4). This agrees with the expected velocity of the escaping atmosphere at the Roche lobe height (Salz et al. 2016). Although this suggests that it originates at very large altitudes, which could be in the outer layer of the thermosphere or even in the exosphere, a simple radiative transfer model is still valid to estimate the velocity and absorption of the feature and thus tentatively fit the profile of the absorption signal. However, this fit does not contain information on the temporal variation of the feature that could support its planetary origin. Further observations are needed to confirm this additional absorption.
4.2 Stellar irradiation and He I signal
Nortmann et al. (2018) presented a relation between the strength of the observed He I absorption and the stellar XUV (5–504 Å) irradiation, similar to that previously observed in stellar coronae by Sanz-Forcada & Dupree (2008). The absorption line originates from neutral helium atoms in an excited metastable 23S state. The population of this level takes place after ionisation of He I atoms by incoming irradiation from the host star, followed by recombination in a cold environment. This radiation is generated in the corona and transition region of late-type stars (late F, G, K and M), and is directly related to the level of activity, which in turn depends mainly on stellar rotation. Therefore, close-in gaseous planets around late-type stars are prime targets to search for the He triplet, considering also that active stars will likely produce higher levels of XUV irradiation.
We place our new measurement of the He I absorption in the transmission spectrum of HD 209458 b in the context of this hypothesis. In Fig. 7, we present an updated version of Fig. 4 from Nortmann et al. (2018), which shows the empirical relation between the stellar irradiation and the detectability of the He I signal. The Y axis indicates the equivalent height of the helium signal (δRp) normalised by the atmospheric scale height (Heq). The values were computed using the data provided by Nortmann et al. (2018) and references therein, except for HD 209458 b (Table 1, δRp ∕Heq = 46.9 ± 4.8), HAT-P-11 b(Allart et al. 2018; Bakos et al. 2010; Deming et al. 2011, δRp ∕Heq = 103.4 ± 4.8), and WASP-107 b (Allart et al. 2019; Anderson et al. 2017, δRp ∕Heq = 87.7 ± 11.3). The X-ray and EUV (0.5–50.4 nm) flux used for the X-axis are from Nortmann et al. (2018), except for HD 209458 b, which flux value (see Table 1) was calculated using a modified version of the coronal model of Sanz-Forcada et al. (2011) and applied as explained by Nortmannet al. (2018). The coronal model was updated after an improved fit of the summed XMM/EPIC spectrum (S∕N = 3.2, log T (K) = 6.0–6.3, log EM (cm−3) = 49.52 , see also Czesla et al. 2017) using the same spectra as in Sanz-Forcada et al. (2011). The coronal model was extended to cooler temperatures using UV line fluxes from France et al. (2010). Because of the lack of X-ray information for KELT-9 b, the corresponding value is indicated as a lower limit. HD 209458 b has so far the weakest signal detected, and is also the planet that receives the least XUV flux from its host star – a relatively low-active G star. Therefore, this measurement is in line with the suggested trend and is relevant to anchor the suspected activity relation at lower irradiation levels.
Although the distribution of all the signals in Fig. 7 is consistent with a dependence on the XUV irradiation level, this may not be the only factor. Oklopčić (2019) modelled the strength of He I absorption in irradiated planetary atmospheresdepending on the spectral type of the hosting star. They suggested that the ratio between extreme- and mid-UV irradiation fluxes determines the amplitude of this absorption, which particularly favours K stars. To what extent the mid-UV flux of HD 209458 is responsible for the weaker helium absorption compared to the other four detections in planets orbiting K stars remains to be investigated.
5 Conclusions
We presenta solid detection of He I λ 10 830 Å in the transmission spectrum of the hot Jupiter HD 209458 b at a level of 0.91 ± 0.10%. This detection concludes a search for He I in this planet atmosphere that has been going on for over a decade (Seager & Sasselov 2000; Moutou et al. 2003; Nortmann et al. 2018). The strength of the detection is consistent with the empirical relationship proposed between the helium signal and the host star activity (Nortmann et al. 2018).
We tentatively detect additional absorption on the blue side of the main helium signal at about −13 km s−1. Although this could be due to cometary-tail-like escape, we are not yet confident about the reliability of the feature. In addition, there is no evidence for pre- or post-transit absorption in the He I triplet. Our spectral detection is consistent with models of atmospheric escape with total hydrogen and helium mass-loss rates of 108 –1011 g s−1 depending on the assumed temperature of the upper atmosphere.
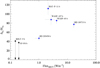 |
Fig. 7 He I transmission signals currently detected (blue stars) and upper limits (black stars), as a function of the stellar irradiation below 504 Å at the planet distance. We show the equivalent height of the He I atmosphere, δRp, normalised by the atmospheric scale height of the lower atmosphere, Heq, of the respective planet. |
Acknowledgements
We thank P. Mollière and A. Wyttenbach for the nice scientific discussions during the preparation of this publication. F.J.A.-F. and I.S. acknowledge funding from the European Research Council (ERC) under the European Union Horizon 2020 research and innovation programme under grant agreement No 694 513. CARMENES is funded by the German Max-Planck-Gesellschaft (MPG), the Spanish Consejo Superior de Investigaciones Científicas (CSIC), the European Union through FEDER/ERF FICTS-2011-02 funds, and the members of the CARMENES Consortium (MaxPlanck-Institut für Astronomie, Instituto de Astrofísica de Andalucía, Landessternwarte Königstuhl, Institut de Ciències de l’Espai, Institut für Astrophysik Göttingen, Universidad Complutense de Madrid, Thüringer Landessternwarte Tautenburg, Instituto de Astrofísica de Canarias, Hamburger Sternwarte, Centro de Astrobiología and Centro Astronómico Hispano-Alemán), with additional contributions by the Spanish Ministry of Economy, the GermanScience Foundation through the Major Research Instrumentation Programme and DFG Research Unit FOR2544 “Blue Planets around Red Stars”, the Klaus Tschira Stiftung, the states of Baden-Württemberg and Niedersachsen, and by the Junta de Andalucía. Financial support was also provided by the Universidad Complutense de Madrid, the Comunidad Autónoma de Madrid, the Spanish Ministerios de Ciencia e Innovación and of Economía y Competitividad, the State Agency for Research of the Spanish MCIU through the “Center of Excellence Severo Ochoa” and Science & Technology Facility Council Consolidated, and the Fondo Social Europeo. The corresponding funding grants are: ESP2014–54 362–P, ESP2014–54 062–R, AYA2015-69 350–C3–2–P, BES–2015–074542, AYA2016-79 425–C3–1/2/3–P, ESP2016–76 076–R, ESP2017–87 143–R, SEV–2017–0709, ST/P000592/1. Based on observations collected at the Centro Astronómico Hispano Alemán (CAHA) at Calar Alto, operated jointly by the Max–Planck Institut für Astronomie and the Instituto de Astrofísica de Andalucía. We thank the anonymous referee for their insightful comments, which contributed to improve the quality of the manuscript.
References
- Allart, R., Bourrier, V., Lovis, C., et al. 2018, Science, 362, 1384 [NASA ADS] [CrossRef] [Google Scholar]
- Allart, R., Bourrier, V., Lovis, C., et al. 2019, A&A, 623, A58 [NASA ADS] [CrossRef] [EDP Sciences] [Google Scholar]
- Anderson, D. R., Collier Cameron, A., Delrez, L., et al. 2017, A&A, 604, A110 [NASA ADS] [CrossRef] [EDP Sciences] [Google Scholar]
- Bakos, G. Á., Torres, G., Pál, A., et al. 2010, ApJ, 710, 1724 [NASA ADS] [CrossRef] [Google Scholar]
- Ben-Jaffel, L. 2007, ApJ, 671, L61 [NASA ADS] [CrossRef] [Google Scholar]
- Bourrier, V., & Lecavelier des Etangs, A. 2013, A&A, 557, A124 [NASA ADS] [CrossRef] [EDP Sciences] [Google Scholar]
- Bourrier, V., Ehrenreich, D., Wheatley, P. J., et al. 2017, A&A, 599, L3 [NASA ADS] [CrossRef] [EDP Sciences] [Google Scholar]
- Bourrier, V., Lecavelier des Etangs, A., Ehrenreich, D., et al. 2018, A&A, 620, A147 [NASA ADS] [CrossRef] [EDP Sciences] [Google Scholar]
- Brogi, M., Line, M., Bean, J., Désert, J.-M., & Schwarz, H. 2017, ApJ, 839, L2 [NASA ADS] [CrossRef] [Google Scholar]
- Caballero, J. A., Guàrdia, J., López del Fresno, M., et al. 2016, SPIE, 9910, 0E [Google Scholar]
- Charbonneau, D., Brown, T. M., Latham, D. W., & Mayor, M. 2000, ApJ, 529, L45 [NASA ADS] [CrossRef] [PubMed] [Google Scholar]
- Charbonneau, D., Brown, T. M., Noyes, R. W., & Gilliland, R. L. 2002, ApJ, 568, 377 [NASA ADS] [CrossRef] [Google Scholar]
- Crossfield, I. J. M., Knutson, H., Fortney, J., et al. 2012, ApJ, 752, 81 [NASA ADS] [CrossRef] [Google Scholar]
- Czesla, S., Salz, M., Schneider, P. C., Mittag, M., & Schmitt, J. H. M. M. 2017, A&A, 607, A101 [NASA ADS] [CrossRef] [EDP Sciences] [Google Scholar]
- Deming, D., Seager, S., Richardson, L. J., & Harrington, J. 2005a, Nature, 434, 740 [NASA ADS] [CrossRef] [PubMed] [Google Scholar]
- Deming, D., Brown, T. M., Charbonneau, D., Harrington, J., & Richardson, L. J. 2005b, ApJ, 622, 1149 [NASA ADS] [CrossRef] [Google Scholar]
- Deming, D., Sada, P. V., Jackson, B., et al. 2011, ApJ, 740, 33 [NASA ADS] [CrossRef] [Google Scholar]
- Dorner, B., Giardino, G., Ferruit, P., et al. 2016, A&A, 592, A113 [NASA ADS] [CrossRef] [EDP Sciences] [Google Scholar]
- Ehrenreich, D., Tinetti, G., Lecavelier des Etangs, A., Vidal-Madjar, A., & Selsis, F. 2006, A&A, 448, 379 [NASA ADS] [CrossRef] [EDP Sciences] [Google Scholar]
- Ehrenreich, D., Lecavelier des Etangs, A., Hébrard, G., et al. 2008, A&A, 483, 933 [NASA ADS] [CrossRef] [EDP Sciences] [Google Scholar]
- Ehrenreich, D., Bourrier, V., Wheatley, P. J., et al. 2015, Nature, 522, 459 [Google Scholar]
- France, K., Stocke, J. T., Yang, H., et al. 2010, ApJ, 712, 1277 [NASA ADS] [CrossRef] [Google Scholar]
- Gaia Collaboration (Brown, A. G. A., et al.) 2018, A&A, 616, A1 [NASA ADS] [CrossRef] [EDP Sciences] [Google Scholar]
- Hawker, G. A., Madhusudhan, N., Cabot, S. H. C., & Gandhi, S. 2018, ApJ, 863, L11 [NASA ADS] [CrossRef] [Google Scholar]
- Henry, G. W., Marcy, G. W., Butler, R. P., & Vogt, S. S. 2000, ApJ, 529, L41 [NASA ADS] [CrossRef] [PubMed] [Google Scholar]
- Høg, E., Fabricius, C., Makarov, V. V., et al. 2000, A&A, 355, L27 [Google Scholar]
- Hoeijmakers, H. J., de Kok, R. J., Snellen, I. A. G., et al. 2015, A&A, 575, A20 [NASA ADS] [CrossRef] [EDP Sciences] [Google Scholar]
- Kausch, W., Noll, S., Smette, A., et al. 2015, A&A, 576, A78 [NASA ADS] [CrossRef] [EDP Sciences] [Google Scholar]
- Knutson, H. A., Charbonneau, D., Noyes, R. W., Brown, T. M., & Gilliland, R. L. 2007, ApJ, 655, 564 [NASA ADS] [CrossRef] [Google Scholar]
- Knutson, H. A., Charbonneau, D., Allen, L. E., Burrows, A., & Megeath, S. T. 2008, ApJ, 673, 526 [NASA ADS] [CrossRef] [Google Scholar]
- Koskinen, T. T., Yelle, R. V., Lavvas, P., & Lewis, N. K. 2010, ApJ, 723, 116 [NASA ADS] [CrossRef] [Google Scholar]
- Kulow, J. R., France, K., Linsky, J., & Loyd, R. O. P. 2014, ApJ, 786, 132 [NASA ADS] [CrossRef] [Google Scholar]
- Lammer, H., Kasting, J. F., Chassefière, E., et al. 2008, Space Sci. Rev., 139, 399 [NASA ADS] [CrossRef] [Google Scholar]
- Lavie, B., Ehrenreich, D., Bourrier, V., et al. 2017, A&A, 605, L7 [NASA ADS] [CrossRef] [EDP Sciences] [Google Scholar]
- Lecavelier des Etangs, A., Ehrenreich, D., Vidal-Madjar, A., et al. 2010, A&A, 514, A72 [NASA ADS] [CrossRef] [EDP Sciences] [Google Scholar]
- Mansfield, M., Bean, J. L., Oklopčić, A., et al. 2018, ApJ, 868, L34 [NASA ADS] [CrossRef] [Google Scholar]
- Mazeh, T., Naef, D., Torres, G., et al. 2000, ApJ, 532, L55 [NASA ADS] [CrossRef] [PubMed] [Google Scholar]
- Montes, D., Fernández-Figueroa, M. J., De Castro, E., et al. 2000, A&AS, 146, 103 [NASA ADS] [CrossRef] [EDP Sciences] [Google Scholar]
- Moutou, C., Coustenis, A., Schneider, J., Queloz, D., & Mayor, M. 2003, A&A, 405, 341 [NASA ADS] [CrossRef] [EDP Sciences] [Google Scholar]
- Nortmann, L., Pallé, E., Salz, M., et al. 2018, Science, 362, 1388 [NASA ADS] [CrossRef] [EDP Sciences] [Google Scholar]
- Oklopčić, A. 2019, ApJ, 881, 133 [NASA ADS] [CrossRef] [Google Scholar]
- Oklopčić, A., & Hirata, C. M. 2018, ApJ, 855, L11 [NASA ADS] [CrossRef] [Google Scholar]
- Parker, E. N. 1958, ApJ, 128, 664 [Google Scholar]
- Quirrenbach, A., Amado, P. J., Caballero, J. A., et al. 2016, SPIE, 9908, 12 [Google Scholar]
- Quirrenbach, A., Amado, P. J., Ribas, I., et al. 2018, SPIE, 10702, 0W [Google Scholar]
- Salz, M., Czesla, S., Schneider, P. C., & Schmitt, J. H. M. M. 2016, A&A, 586, A75 [NASA ADS] [CrossRef] [EDP Sciences] [Google Scholar]
- Salz, M., Czesla, S., Schneider, P. C., et al. 2018, A&A, 620, A97 [NASA ADS] [CrossRef] [EDP Sciences] [Google Scholar]
- Sanz-Forcada, J., & Dupree, A. K. 2008, A&A, 488, 715 [NASA ADS] [CrossRef] [EDP Sciences] [Google Scholar]
- Sanz-Forcada, J., Micela, G., Ribas, I., et al. 2011, A&A, 532, A6 [NASA ADS] [CrossRef] [EDP Sciences] [Google Scholar]
- Schwarz, H., Brogi, M., de Kok, R., Birkby, J., & Snellen, I. 2015, A&A, 576, A111 [NASA ADS] [CrossRef] [EDP Sciences] [Google Scholar]
- Seager, S., & Sasselov, D. D. 2000, ApJ, 537, 916 [NASA ADS] [CrossRef] [Google Scholar]
- Seifert, W., Sánchez Carrasco, M. A., Xu, W., et al. 2012, SPIE, 8446, 33 [Google Scholar]
- Shulyak, D., Reiners, A., Nagel, E., et al. 2019, A&A, 626, A86 [NASA ADS] [CrossRef] [EDP Sciences] [Google Scholar]
- Skrutskie, M. F., Cutri, R. M., Stiening, R., et al. 2006, AJ, 131, 1163 [NASA ADS] [CrossRef] [Google Scholar]
- Smette, A., Sana, H., Noll, S., et al. 2015, A&A, 576, A77 [NASA ADS] [CrossRef] [EDP Sciences] [Google Scholar]
- Snellen, I. A. G., Albrecht, S., de Mooij, E. J. W., & Le Poole, R. S. 2008, A&A, 487, 357 [NASA ADS] [CrossRef] [EDP Sciences] [Google Scholar]
- Snellen, I. A. G., de Kok, R. J., de Mooij, E. J. W., & Albrecht, S. 2010, Nature, 465, 1049 [NASA ADS] [CrossRef] [PubMed] [Google Scholar]
- Spake, J. J., Sing, D. K., Evans, T. M., et al. 2018, Nature, 557, 68 [NASA ADS] [CrossRef] [EDP Sciences] [Google Scholar]
- Swain, M. R., Tinetti, G., Vasisht, G., et al. 2009, ApJ, 704, 1616 [NASA ADS] [CrossRef] [Google Scholar]
- Torres, G., Winn, J. N., & Holman, M. J. 2008, ApJ, 677, 1324 [NASA ADS] [CrossRef] [Google Scholar]
- Vidal-Madjar, A., Lecavelier des Etangs, A., Désert, J.-M., et al. 2003, Nature, 422, 143 [NASA ADS] [CrossRef] [PubMed] [Google Scholar]
- Vidal-Madjar, A., Désert, J.-M., Lecavelier des Etangs, A., et al. 2004, ApJ, 604, L69 [NASA ADS] [CrossRef] [Google Scholar]
- Vidal-Madjar, A., Huitson, C. M., Bourrier, V., et al. 2013, A&A, 560, A54 [NASA ADS] [CrossRef] [EDP Sciences] [Google Scholar]
- Wright, J. T., Fakhouri, O., Marcy, G. W., et al. 2011, PASP, 123, 412 [NASA ADS] [CrossRef] [Google Scholar]
- Zechmeister, M., Anglada-Escudé, G., & Reiners, A. 2014, A&A, 561, A59 [NASA ADS] [CrossRef] [EDP Sciences] [Google Scholar]
The error is an approximation obtained from the average transmission spectrum provided by Allart et al. (2018).
Program H18-3.5-022, P.I: S. Czesla. After one year from the observation date, the reduced spectra can be downloaded from the Calar Alto archive, http://caha.sdc.cab.inta-csic.es/calto/
All Tables
All Figures
|
Fig. 1 Change in airmass (top), precipitable water vapour (middle), and signal-to-noise ratio (bottom) during observations (mid-transit ~00:39 UT). Vertical dashed lines indicate the first, second, third, and fourth contact, respectively. The lack of data around −2.3 h was due to a loss in the tracking system. The post-transit observations not included in the analysis are shown in grey. The out-of-transit red diamonds were used to compute the master spectrum of Fig. 2. |
| In the text | |
|
Fig. 2 Master spectrum in the vicinity of the He I triplet (blue line). The vertical lines indicate the positions of the three He I lines. The grey line indicates the average telluric absorption spectrum and the sky emission lines removed from the data. The latter were highly variable during the night. The masked cores of telluric absorption lines in Fig. 3 are indicated by thicker red lines. The stellar line blueward from the He triplet is Si I. |
| In the text | |
|
Fig. 3 Time sequence of the residual spectra around the He I triplet, after removal of the stellar and telluric absorption and the sky emission lines, with the relative flux indicated in greyscale. The radial velocity in the stellar rest-frame is on the horizontal axis, and orbital phase on the vertical axis. The corresponding wavelengths in the rest-frame of the star are indicated in the top axis. The area around orbital phase −0.03 is blanked out due to the lack of observations. The horizontal dashed lines indicate the first, second, third, and fourth contact of the transit, respectively. A helium signal is visible (darker greyscales), following the planet velocity (slanted lines) from −16 to +16 km s−1. |
| In the text | |
|
Fig. 4 Average transmission spectrum around the He I triplet in the planet rest-frame. The positions of the three helium lines are marked by vertical lines. The red curve is the best-fit Parker wind model obtained for a temperature of 6000 K and a mass-loss rate of 4.2 × 10⁹ g s−1. The blue line indicates a model for a tentative blueward component centred at around −13 km s−1. The magenta dashed curve is the combination of the red and blue lines. |
| In the text | |
|
Fig. 5 Histograms of the mean absorption levels in the average transmission spectra generated in our bootstrap analysis when considering only spectra between the second and third contact (left) and a control sample including only the out-of-transit observations (right). |
| In the text | |
|
Fig. 6 Light curve of the He I absorption centred on the observed core of the line and using a width of Δλ ~ 0.9 Å (total Δv = 25.3 km s−1). Vertical dashed lines indicate the first, second, third, and fourth contact, respectively. There is no evidence for any out-of-transit absorption. |
| In the text | |
|
Fig. 7 He I transmission signals currently detected (blue stars) and upper limits (black stars), as a function of the stellar irradiation below 504 Å at the planet distance. We show the equivalent height of the He I atmosphere, δRp, normalised by the atmospheric scale height of the lower atmosphere, Heq, of the respective planet. |
| In the text | |
Current usage metrics show cumulative count of Article Views (full-text article views including HTML views, PDF and ePub downloads, according to the available data) and Abstracts Views on Vision4Press platform.
Data correspond to usage on the plateform after 2015. The current usage metrics is available 48-96 hours after online publication and is updated daily on week days.
Initial download of the metrics may take a while.