Fig. 4
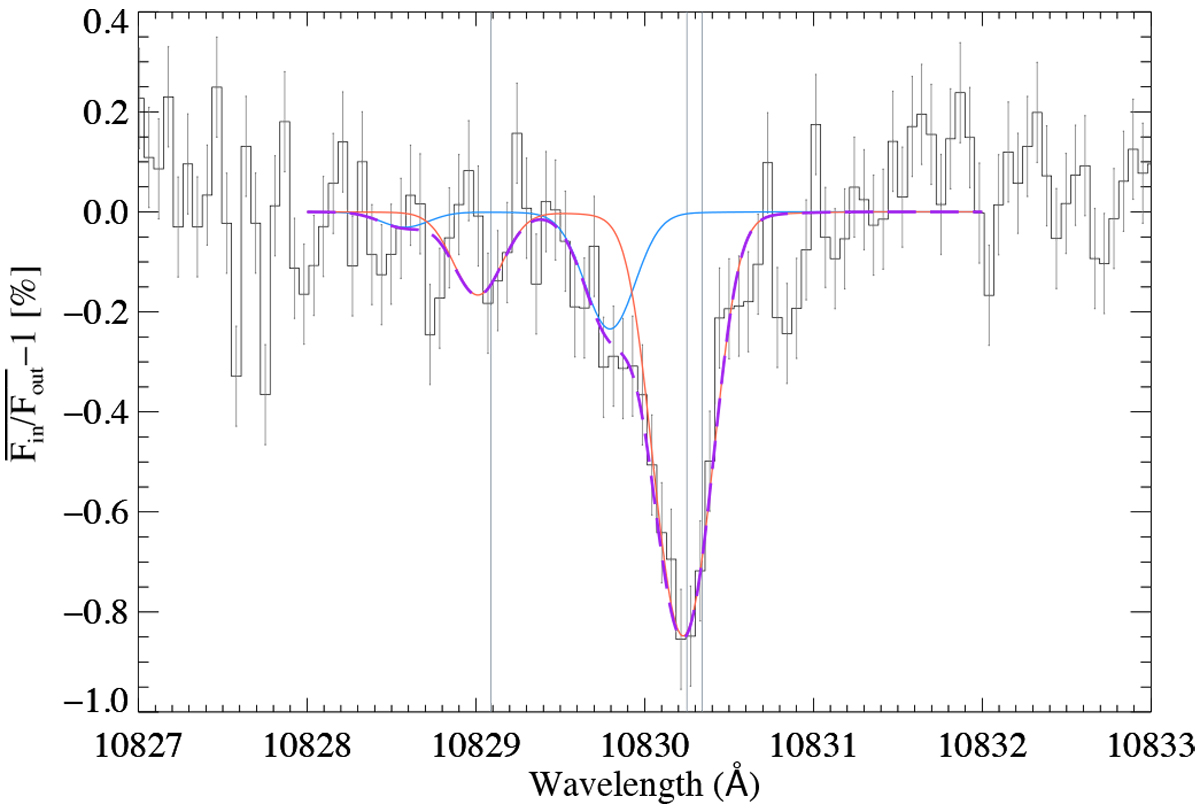
Average transmission spectrum around the He I triplet in the planet rest-frame. The positions of the three helium lines are marked by vertical lines. The red curve is the best-fit Parker wind model obtained for a temperature of 6000 K and a mass-loss rate of 4.2 × 10⁹ g s−1. The blue line indicates a model for a tentative blueward component centred at around −13 km s−1. The magenta dashed curve is the combination of the red and blue lines.
Current usage metrics show cumulative count of Article Views (full-text article views including HTML views, PDF and ePub downloads, according to the available data) and Abstracts Views on Vision4Press platform.
Data correspond to usage on the plateform after 2015. The current usage metrics is available 48-96 hours after online publication and is updated daily on week days.
Initial download of the metrics may take a while.