Fig. 1
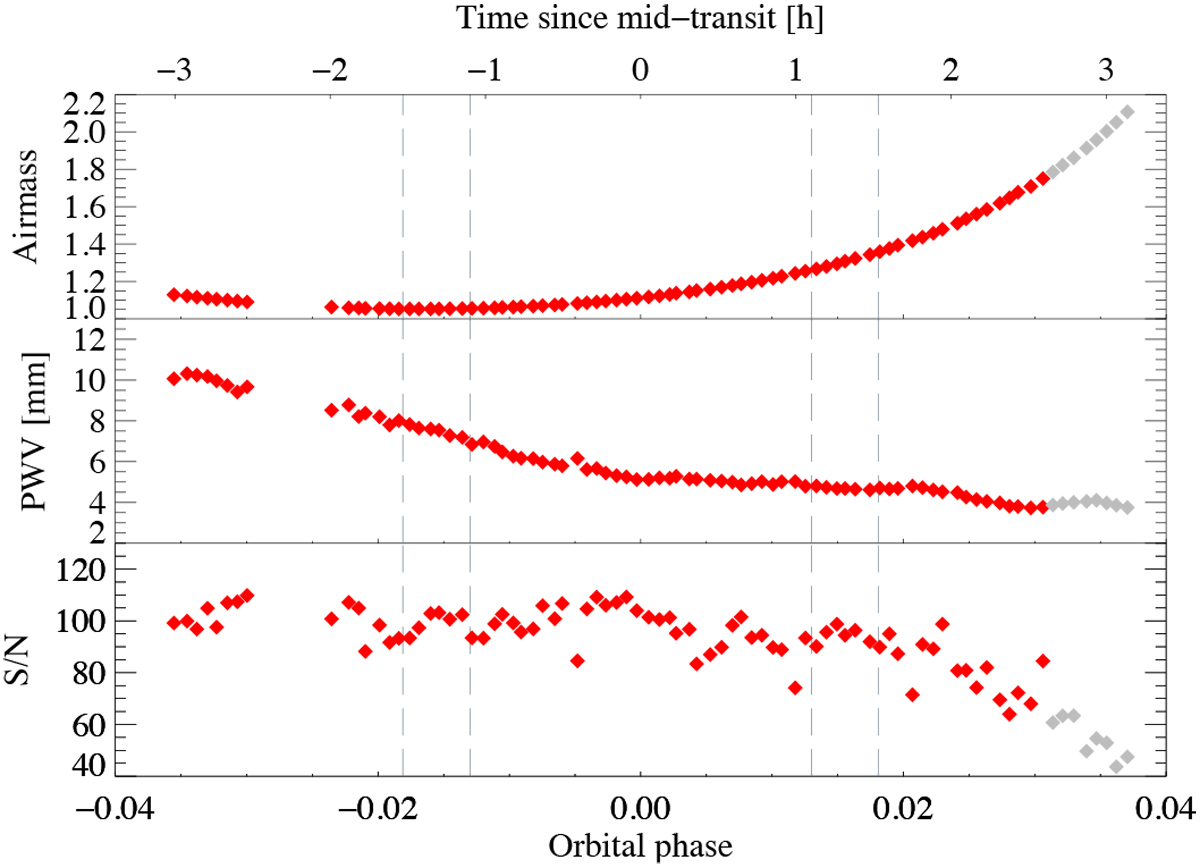
Change in airmass (top), precipitable water vapour (middle), and signal-to-noise ratio (bottom) during observations (mid-transit ~00:39 UT). Vertical dashed lines indicate the first, second, third, and fourth contact, respectively. The lack of data around −2.3 h was due to a loss in the tracking system. The post-transit observations not included in the analysis are shown in grey. The out-of-transit red diamonds were used to compute the master spectrum of Fig. 2.
Current usage metrics show cumulative count of Article Views (full-text article views including HTML views, PDF and ePub downloads, according to the available data) and Abstracts Views on Vision4Press platform.
Data correspond to usage on the plateform after 2015. The current usage metrics is available 48-96 hours after online publication and is updated daily on week days.
Initial download of the metrics may take a while.