| Issue |
A&A
Volume 629, September 2019
|
|
|---|---|---|
| Article Number | A75 | |
| Number of page(s) | 18 | |
| Section | Interstellar and circumstellar matter | |
| DOI | https://doi.org/10.1051/0004-6361/201834388 | |
| Published online | 09 September 2019 | |
First detections of H13CO+ and HC15N in the disk around HD 97048
Evidence for a cold gas reservoir in the outer disk★
School of Physics and Astronomy, University of Leeds,
Leeds
LS2 9JT,
UK
e-mail: pyasb@leeds.ac.uk
Received:
5
October
2018
Accepted:
17
July
2019
Observations of different molecular lines in protoplanetary disks provide valuable information on the gas kinematics, as well as constraints on the radial density and temperature structure of the gas. With ALMA we have detected H13CO+ (J = 4–3) and HC15N (J = 4–3) in the HD 97048 protoplanetary disk for the first time. We compare these new detections to the ringed continuum mm-dust emission and the spatially resolved CO (J = 3–2) and HCO+ (J = 4–3) emission. The radial distributions of the H13CO+ and HC15N emission show hints of ringed sub-structure whereas, the optically thick tracers, CO and HCO+, do not. We calculate the HCO+/H13CO+ intensity ratio across the disk and find that it is radially constant (within our uncertainties). We use a physio-chemical parametric disk structure of the HD 97048 disk with an analytical prescription for the HCO+ abundance distribution to generate synthetic observations of the HCO+ and H13CO+ disk emission assuming LTE. The best by-eye fit models require radial variations in the HCO+/H13CO+ abundance ratio and an overall enhancement in H13CO+ relative to HCO+. This highlights the need to consider isotope selective chemistry and in particular low temperature carbon isotope exchange reactions. This also points to the presence of a reservoir of cold molecular gas in the outer disk (T ≲ 10 K, R ≳ 200 au). Chemical models are required to confirm that isotope-selective chemistry alone can explain the observations presented here. With these data, we cannot rule out that the known dust substructure in the HD 97048 disk is responsible for the observed trends in molecular line emission, and higher spatial resolution observations are required to fully explore the potential of optically thin tracers to probe planet-carved dust gaps. We also report non-detections of H13CO+ and HC15N in the HD 100546 protoplanetary disk.
Key words: astrochemistry / stars: individual: HD 97048 / stars: individual: HD 100546 / stars: pre-main sequence / protoplanetary disks / submillimeter: planetary systems
A copy of the reduced datacubes is available at the CDS via anonymous ftp to cdsarc.u-strasbg.fr (130.79.128.5) or via http://cdsarc.u-strasbg.fr/viz-bin/qcat?J/A+A/629/A75
© ESO 2019
1 Introduction
Spatially resolved Atacama Large Millimeter/submillimeter Array (ALMA) observations of the (sub-)millimetre-sized dust grains in protoplanetary disks are providing incredible insights into the processes controlling how disks evolve and how planets form. ALMA has detected multiple concentric rings of continuum emission from disks around both Herbig Ae/Be and T Tauri stars, e.g., HD 100546 and HL Tau (Walsh et al. 2014; ALMA Partnership 2015). Disks around Herbig Ae stars are the progenitors of gas-giant planetary systems around A-type stars, which have the highest occurrence rate of gas-giant planets across the stellar mass range (Reffert et al. 2015; Nielsen et al. 2019). The observed structures in disks have been proposed to signify planet formation where the apparent gaps are the result of dynamical clearing due to forming planets or massive companions (e.g., Pinilla et al. 2012). Recent results show that rings are the most common sub-structure observed in the mm-sized dust and the lack of a clear trend in these structures with host star properties favours planets as the likely explanation (Andrews et al. 2018; Huang et al. 2018).
Gas cavities in the inner disk associated with dust cavities have been resolved in CO isotopologue emission and can be used to determine the cause of the cavity (van der Marel et al. 2015, 2016). Gas density perturbations associated with dust rings ~100’s of au from the central star are less commonly observed. Examples have been seen with ALMA in the HD 163296, HD 169142 and AS 209 protoplanetary disks (Isella et al. 2016; Fedele et al. 2017; Favre et al. 2019) where the 12CO, 13CO and C18O line observations do not follow the exact same radial profiles as the dust, but there is a change in slope of these line intensity profiles thatcoincides with the location of the dark rings postulated to be dust gaps.
Although CO isotopologues are the most common tracers of the molecular gas in disks, it is beneficial to observe lines from other molecules to gain more information about the physical and chemical conditions of the gas. Since gas-phase CO is present in high abundance throughout the most of the disk, observations of CO can suffer from optical depth effects such that the emission traces the upper disk layers only. Observations of increasingly rarer isotopologues, e.g., 13C18O (Zhang et al. 2017) and 13C17O (Booth et al. 2019b), can help to mitigate these optical depth effects. Species other than CO can be more powerful tracers of physical conditions because the abundances are more sensitive to changes in the disk’s physical conditions. For most of the disk, the chemistry of CO can be described simply by freeze out and photodissociation, whereas other species’ abundances are more dependent on the, e.g., gas number density and ionisation fraction.
A legacy of observations of protoplanetary disks with single dish telescopes have showed that HCO+ and HCN are two of the brightest molecules in these objects (e.g., Kastner et al. 1997; Dutrey et al. 1997; van Zadelhoff et al. 2001; Thi et al. 2004; Piétu et al. 2007; Chapillon et al. 2012). Emission from HCO+ and HCN and selected isotopologues have now been spatially resolved in a number of disks with ALMA (e.g. Huang et al. 2017; Guzmán et al. 2017) and exhibit centrally peaked or ringed radial emission profiles. These observed morphologies highlight the different physical and chemical processes that shape the abundance distributions of molecules in disks.
HCO+ emission from the main isotopologue tends to be optically thick in disks and traces the dense gas. From the aforementioned observationsand supporting chemical models (e.g., Aikawa et al. 2015) this cation resides primarily in the warm molecular layer. HCO+ is commonly used to investigate disk ionisation and kinematics (e.g., Guilloteau et al. 1999; van Zadelhoff et al. 2001; Öberg et al. 2010, 2011; Cleeves et al. 2014; Teague et al. 2015). The chemical models conducted by Cleeves et al. (2015) coupled with observations, including of HCO+, reported evidence for the exclusion of cosmic rays from a protoplanetary disk due to stellar winds and/or the magnetic field of the accreting host star. Spatially unresolved observations of HCO+ emission from LkCa 15 with JCMT have been used to constrain the gas-to-dust mass ratio in the dust cavity by modelling the line wing flux (Drabek-Maunder et al. 2016). They find that in the cavity the gas-to-dust mass ratio has to be increased by ≳ 104 relative to the ISM indicating a significant reservoir of molecular gas within the dust cavity. Deviations from global Keplerian gas motion in the inner cavities of disks have also been inferred through inspection of the intensity weighted-velocity field of HCO+ line emission, i.e., the first-moment map (Casassus et al. 2013, 2015a; Rosenfeld et al. 2014; Loomis et al. 2017).
Another abundant disk molecule is HCN. The CN∕HCN ratio is used to trace the UV radiation field across disks because HCN can only exist in regions where the surface density is high enough to attenuate this radiation, thus preventing photodissociation (Öberg et al. 2010; Chapillon et al. 2012). In comparison, CN emission is observed to be more radially extended, especially in Herbig disks, because it can survive in the low density atmosphere. Rings of CN emission have been detected in a few protoplanetary disks with ALMA (e.g., TW Hydrae; Teague et al. 2016). Chemical modelling shows that these rings arise naturally in disks as a result of chemistry and are not formed as a result of an underlying ringed dust structure (Cazzoletti et al. 2018). The isotopologue, HC15N, was first detected in the MWC 480 Herbig Ae protoplanetary disk (Guzmán et al. 2015). The 14N∕15N ratio observed in protoplanetary disks can help us to better understand the origin of the nitrogen fractionation and thus chemical history of our solar system (Füri & Marty 2015). In the MWC 480 disk the 14N∕15N ratio determined from observations of CN, HCN, H13CN, and HC15N is 200 ± 100 and this is similar to the value derived from C14N and C15N observations of TW Hya (323 ± 32 Hily-Blant et al. 2017). These values are low relative to solar wind value of ≈440 (Marty et al. 2011). The solar wind value is similar to what is measured for cloud cores and comets indicating active fractionation processes occurring in both cores and disks that are then preserved in the cometary record.
From the observations conducted thus far, it is clear that molecular line observations from tracers such as HCO+ and HCN in protoplanetary disks provide valuable information on the physical conditions and kinematics of the emitting gas, as well as constraints on the radial structure of the gas. Here we present the first detections of H13CO+ and HC15N in the disk around the Herbig Ae star, HD 97048 using ALMA Cycle 0 observations. Using our CO observations and complementary archival ALMA Cycle 2 observations of HCO+, we compare the radial distribution of these four different gas tracers to the mm-sized dust emission. The aim of this work is to investigate whether or not chemistry alone can explain the radial emission profiles of these molecules, or if modifications to the underlying disk gas structure are required. Section 2 gives an overview of previous observations of the source, Sect. 3 details the observations and data reduction, Sect. 4 presents the molecular line detections. We then describe our modelling in Sect. 5, in Sect. 6 we discuss our results, and in Sect. 7 we state our conclusions.
2 The source: HD 97048
HD 97048 is a 2.5 M⊙ Herbig Ae/Be star with spectral type B9/A0 (van den Ancker et al. 1998; van Leeuwen 2007) located in the Chameleon I star-forming region at 11:08:03.2, − 77:39:17 at a distance of  pc (Vioque et al. 2018). This young (≈4 Myr) star is host to a large circumstellar disk seen with an inclination angle of 41° and a position angle of 3° (e.g., Walsh et al. 2016). We note that the disk sizes and radial positions that follow have been scaled to account for the new source distance as determined from Gaia Data Release 2 (Gaia Collaboration 2018).
HD 97048 is a source that has been well studied from optical to infra-red (IR) wavelengths, with observations revealing much substructure in the warm gas and small dust grains. The transitional nature of this disk was first revealed by Maaskant et al. (2013) from modelling the spectral energy distribution (SED) and azimuthally averaged mid-IR brightness profile. The best fit model for these observations is a dust cavity out to a radius of 40 ± 5 au and an inner dust disk between 0.4 and 3 au. The detection of [OI] line emission also suggests the presence of an inner gas disk (Acke & van den Ancker 2006). Spectrally resolved observations of CO ro-vibrational transitions show that the molecular gas extends to at least 102 au and that there is a cavity in the CO emission out to 11 au (van der Plas et al. 2009, 2015). The origin of the CO cavity is proposed to be due to photodissociation of the CO gas by stellar radiation.
The first resolved near-IR scattered light images of the HD 97048 disk revealed the inner 19–190 au and alluded to a gap in the disk from 110–150 au (Quanz et al. 2012). Subsequent high-resolution observations with VLT/SPHERE show four rings in the disk with observations covering 45–400 au from the star (Ginski et al. 2016). The disk has also been observed with the Hubble Space Telescope where circumstellar material was observed between 365 au and 736 au from the star (Doering et al. 2007).
The first spatially resolved observations of the mm-sized dust and molecular gas were presented by Walsh et al. (2016) using ALMA and these data revealed the full spatial extent of the molecular disk. The mm-sized dust is observed to extend to 400 au in radius; while, in comparison, the flared molecular disk, revealed in CO J = 3−2 emission, is significantly larger and extends to 860 au. These observations also support the transitional and ringed nature of the disk. There is a decrease in the continuum flux within 55 au and there are three continuum emission rings peaking at 55, 160 and 290 au. More recent ALMA observations have now resolved the inner cavity at mm wavelengths (van der Plas et al. 2017). These latter observations also report the detection of emission from the HCO+ J = 4−3 transition as well as the CO J = 3−2 transition. The HCO+ emission is more compact than that for CO, extending out to 540 au only. There is also evidence for deviations from global Keplerian rotation in the HCO+ emission on small scales, possibly due to radial flows or an inclined inner disk (van der Plas et al. 2017).
Although this is the brightest disk observed at sub-mm wavelengths, it remains poorly studied in terms of its molecular content. Particularly lacking are spatially resolved observations of key molecular tracers aside from those reported above. Nevertheless, thanks in part to observations with Herschel, it is known to host a chemically-rich gaseous disk. Spatially unresolved emission lines that have been observed include those from H2, [OI], [CII], OH and CH+ (Carmona et al. 2011; Meeus et al. 2012, 2013; Fedele et al. 2013).
ALMA Band 7 observations and detected molecular lines in the HD 97048 protoplanetary disk.
3 Observations
3.1 Datareduction
Table 1 lists the two sets of ALMA observations used in this work as well as the detected molecular lines. The continuum emission, and CO andHCO+ line emission from the two datasets have already been presented in previous work (see Walsh et al. 2016; van der Plas et al. 2017 for full details). This work uses the self-calibrated, phase-corrected, and continuum-subtracted measurement sets from the Cycle 0 program 2011.0.00863.S (PI: C. Walsh) and the raw archival data from the Cycle 2 program 2013.1.00658.S (PI: G. vander Plas). These latter data were self-calibrated using CASA (version 4.6.0). This dataset consists of four spectral windows, two of which were tuned for continuum observations and two of which were centred on the CO J = 3−2 and HCO+ J = 4−3 spectral lines. The two broadband continuum windows were self-calibrated after flagging the line containing channels and then used to self-calibrate the respective higher spectral resolution CO J = 3−2 and HCO+ J = 4−3 line containing spectral windows. We ensured that the data was phase-centred on source and subtracted the continuum emission from the two line containing spectral windows using the CASA task, uvcontsub. Additionally, we checked that continuum subtraction in the uv domain did not over-subtract the CO or HCO+ emission (Boehler et al. 2017). This was done by comparing two line profiles extracted from data cubes with and without continuum subtraction in the uv domain. In the latter case, a simple baseline continuum subtraction was done directly on the extracted line profile. It was found that the line profiles for both species (CO and HCO+) using both methods agree to within 1σ, where σ is the root-mean-square (rms) noise as determined from the nearby line-free channels.
3.2 Molecular line imaging
The lines listed in Table 1 were imaged in CASA using CLEAN with natural weighting and using a Keplerian mask1. The use of such a mask generates improved moment maps (e.g. Salinas et al. 2017). The Keplerian mask was set to encompass emission from 1 to 800 au using an estimated local linewidth of 1 km s−1 at 100 au. Table 1 lists the rms noise (σ) of each line imaged at its respective Hanning-smoothed spectral resolution, as well as the image parameters, and the intrinsic properties of the transitions. A comparison of the peak flux densities and integrated intensities for the CO J = 3−2 line that was observed in both datasets used here shows that they agree to within 10% (see Walsh et al. 2016, for details).
The CO J = 3−2 line emission suffers from missing emission about the source velocity, from 3.4 to 5.7 km s−1 inclusive. This is the result of either spatial filtering due to bright background emission or foreground absorption. Spatial filtering is a possibility because the source is in proximity to the Chameleon I molecular cloud. This effect is seen in both the channel maps and line profiles presented by Walsh et al. (2016) and van der Plas et al. (2017). This work focuses on the detection of H13CO+ and HC15N and there is no indication that they are also affected by this phenomenon. A possible explanation is that this is due to the higher-lying energy levels of these transitions (see Table 1) or, due to the lower abundances of HCO+, H13CO+, and HC15N, in either background or foreground material, when compared with CO.
3.3 Non-detections in the HD 100546 protoplanetary disk
The protoplanetary disks around HD 97048 and HD 100546 were observed with the same spectral setup during the Cycle 0 ALMA campaign described above (2011.0.00863.S). We did not detect the H13CO+ J = 4−3 and HC15N J = 4−3 transitions in our complementary observations of HD 100546 (see Walsh et al. 2014; Booth et al. 2018). The lines were imaged in CLEAN using natural weighting and the 1σ rms noise level in the channel maps at a velocity resolution of 1 km s−1 is 8 mJy beam−1 per channel and 10 mJy beam−1 per channel for H13CO+ and HC15N, respectively.This result highlights the differences between the molecular nature of these two Group I Herbig Ae/Be disks (as also discussed for the case of SO by Booth et al. 2018). We will further discuss these implications in Sect. 6.
4 Results
4.1 Channel maps, moment maps, and line profiles
Figure 1 shows the HCO+ and H13CO+ channel maps at the native spectral resolution of the H13CO+ data, 0.21 km s−1. We slightly over-sample the HCO+ data in order to allow a direct comparison between the two molecules. Both channel maps have a 1σ rms noise level of 0.016 Jy beam−1 channel−1 and reach a S/N of 23 and 6, respectively. To obtain a robust detection of HC15N in the channel maps the data were re-binned to a velocity resolution of 0.5 km s−1, and these channel maps are shown in Appendix A. The H13CO+ channel maps at the same velocity resolution are also shown in Appendix B for ease of comparison.
For HCO+, the highest velocities at which emission is robustly detected (>3σ within a 0. ′′5 aperture) are in channels at −0.17 and 9.55 km s−1, for the blue- and red-shifted emission, respectively. Assuming a disk inclination of 41° and a stellar mass of 2.5 M⊙, HCO+ emission is detected down to an average radial distance of 41 ± 2 au. This is different to the value of 28 au stated by van der Plas et al. (2017); however, note that we use different imaging parameters. Here, we adopt natural weighting in the imaging to enhance the S/N for the detected lines. On the other hand, van der Plas et al. (2017) used Briggs weighting in their imaging resulting in a smaller synthesised beam. In comparison, the highest velocity CO emission from both the Cycle 0 and Cycle 2 data as determined here corresponds to emission detected down to an average radial distance of 14 ± 1 au. This is in agreement with van der Plas et al. (2017). The errors in these radii are propagated from the velocity resolution of the channel maps (see Table 1).
The integrated intensity maps and the intensity-weighted velocity maps for HCO+, H13CO+ and HC15N are presented in Fig. 2. The moment 0 maps were made using a Keplerian mask and the moment 1 maps were made using a 3σ clip. The HCO+ intensity-weighted velocity map has a clear Keplerian velocity pattern on large spatial scales and both the H13CO+ and HC15N intensity-weighted velocity maps are consistent with this.
Figure 3 shows the H13CO+ and HC15N line profilesmirrored about the source velocity. The H13CO+ line profile was extracted from within the region defined by the 3σ contour of the HCO+ integrated intensity (see Fig. 2). The extraction region for the HC15N line profile was chosen by eye due to the low signal-to-noise ratio (S/N). An ellipse that encompassed the extent of the emission in the integrated intensity map and centred on source was used. The line profiles cover a velocity range of ± 15 km s−1 about the source velocity and are shown at a velocity resolution of 0.5 km s−1. They reach a S/N of 5 and 3 with a 1σ noise level of 0.048 and 0.035 Jy, respectively. The residuals of the mirrored line profiles were calculated to show that the emission is not significantly asymmetric and to further confirm the Keplerian nature of the emission.
4.2 Deprojection and azimuthal averaging
To better quantify the radial structure of the emission from each molecular transition, the Keplerian-masked integrated intensity maps were deprojected and azimuthally averaged. This is an effective method to increase S/N assuming that the emission is azimuthally symmetric (e.g., Yen et al. 2016). All pixels in each map were placed into radial bins depending on the deprojected radius, and the average value per bin calculated. The bin size chosen was 0. ′′ 3 because thisis two times the pixel size of the images and is approximately half of the beam size. The recovered fluxes and trends in the resulting radial profiles are consistent with radial profiles generated from un-clipped and un-masked integrated intensity maps.
The radial intensity profiles for CO, HCO+, H13CO+, and HC15N are shown in Fig. 4. The associated errors are the standard deviation of the pixel values in each bin divided by the square root of the number of beams per annulus (see e.g. Carney et al. 2018). Also plotted is the mm-dust radial profile from Walsh et al. (2016) where the image was generated using super-uniform weighting in CLEAN. The continuum profile shown by the grey dashed line in Fig. 4 is that derived from modelling the emission in the uv domain. The profile has rings which peak at 55 and 160 au with a gap at 110 au and an additional shoulder of emission at 290 au. Although these data were lower spatial resolution than that presented in van der Plas et al. (2017), modelling the continuum emission in the uv domain successfully predicted the presence and location of the outer ring(s) that were subsequently imaged in that work (see also Zhang et al. 2016).
The radial profiles of the CO and HCO+ emission show no deviation from a monotonically decreasing radial distribution. As discussed previously, the CO J = 3−2 emission suffers from missing emission about the source velocity, from 3.4 to 5.7 km s−1; therefore, the radial profile that we derive likely underestimates the CO flux from the disk. The profile is centrally peaked because the observations do not have the spatial resolution to resolve the inner CO cavity detected in CO ro-vibrational lines (van der Plas et al. 2009). The HCO+ J = 4−3 is also expected to be optically thick and the radial profile is also centrally peaked. In comparison, the more optically thin tracers, H13CO+ and HC15N, show a different radial behaviour.
The H13CO+ J = 4−3 radial profile is also centrally peaked but the intensity does not fall off as steeply as the profile for HCO+. Additionally, the intensity profile appears to have a step-like morphology compared to the smooth HCO+ profile. These changes in slope coincide approximately with the locations of the second and third continuum emission rings.
Comparatively, the HC15N profile appears to have a ring-like morphology with the peak in emission occurring at ≈ 100 au. This is consistent with the moment 0 map shown in Fig. 2, but due to the low S/N of the data a centrally peaked smooth radial intensity profile cannot be ruled out. Also plotted in Fig. 4 with a black dashed line is the mm-dust radial profile from Walsh et al. (2016) convolved with a 50 au beam. The HC15N follows the mm-sized dust distribution at the spatial resolution of the currently available observations. Further analysis of the HC15N emission is not conducted here due to the unavailability of observations of line emission from the main isotopologue, HCN.
The HCO+ to H13CO+ integrated intensity ratio across the disk is shown in Fig. 5. To directly compare the HCO+ and H13CO+ emission from the disk, the channel maps have been smoothed to the same beam size using the CASA task, imsmooth. The new beam is 0. ′′ 7 × 0. ′′6 with a position angle of − 26°. We also tried the same analysis using a uvtaper when CLEANing the lines to enforce a common beam and found that the results were consistent with using imsmooth. New moment maps were generated and radial profiles from the resulting integrated intensity maps used to calculate the HCO+ to H13CO+ integrated intensity ratio across the disk. The smoothed radial profiles are also shown in Fig. 5. The plotted ratio is truncated at the point where the H13CO+ profile falls below the noise level. The computed errors have been propagated from the standard error for each profile generated during azimuthal averaging. The expected ratio is ≈69 for the case where both lines are optically thin, reflecting the underlying elemental ratio for 12C/13C in the ISM (e.g., Wilson 1999). The observed ratio decreases slightly with radius but is constant across the disk within the error bars, and has an average value of 12 ± 3. This is much lower than the canonical value and confirms that at least the HCO+ emission is optically thick.
 |
Fig. 1 HCO+ (top) and H13CO+ (bottom) channel maps with a velocity resolution of 0.21 km s−1. The rms noise, σ, is 0.016 Jy beam−1 per channel in both maps and the emission is detected with a S/N of 25 and 7, respectively. The grey dashed contour shows the Keplerian mask used and the dotted white lines mark the major and minor axes of the disk. |
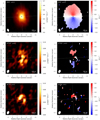 |
Fig. 2 Integrated intensity maps (left) and intensity-weighted velocity (right) for the HCO+ J = 4− 3 (top), H13CO+ J = 4− 3 (middle) and HC15N J = 4− 3 (bottom) transitions generated using the Keplerian masks shown in Figs. 1 and A.1. The S/N of the integrated intensity maps are 20, 3 and 3, respectively. The intensity-weighted velocity maps were made using a 3σ clip in the channel maps. The dotted white lines mark the major and minor axes of the disk. |
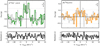 |
Fig. 3 Line profiles of the H13CO+ (left) and HC15N (right) emission at a velocity resolution of 0.5 km s−1 and mirrored about the source velocity. The H13CO+ line profile isextracted from within the region encompassing the 3σ extent of the HCO+ integrated intensity and the HC15N extraction region is an ellipse centred on source and chosen by eye. The residuals from the mirrored line profiles are also shown. |
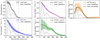 |
Fig. 4 Deprojected and azimuthally-averaged radial profiles of the continuum emission, and CO, HCO+, H13CO+, HC15N line emission ratio (from top to bottom, then left to right). The coloured shaded region on each profile represents the errors (see text for details). The vertical dashed grey lines highlight the rings and gaps in the mm-dust continuum profile and the dashed grey profile is the best-fit model of the continuum uv data from (Walsh et al. 2016) and is normalised to the peak value in each plot. The dotted black line on the HC15N plot is the continuum model convolved with a 50 au beam from Walsh et al. (2016) and is normalised to the peak value in each plot. |
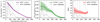 |
Fig. 5 Deprojected and azimuthally-averaged radial profiles of the HCO+ and H13CO+ line emissionsmoothed to a common beam and the subsequent HCO+/H13CO+ ratio (from left to right). The coloured shaded region on each profile represents the errors (see text for details). The vertical dashed grey lines highlight the rings and gaps in the mm-dust continuum profile and the dashed grey profile is the best-fit model of the continuum uv data from Walsh et al. (2016) and is normalised to the peak value in each plot. |
5 Chemical modelling
In this section we investigate the origin of the radial distribution of the detected H13CO+ emission and the HCO+/H13CO+ integrated intensity ratio. We model the line emission from both molecules to explore two hypotheses (i) whether or not chemistry alone can explain the radial emission profiles, or, (ii) if modifications to the underlying disk structure need to be invoked (e.g., gas cavities). We note that we do not attempt to model the HC15N emission since we do not have complementary observations of the main isotopologue HCN. However, we discuss this detection and related chemistry in Sect. 6.
For the underlying physical disk structure we use the publicly available HD 97048 disk structure from the DIscANAlysis project (DIANA)2. The aim of this large collaboration is to generate disk models that can reproduce multi-wavelength (from UV to sub-mm) observations of sources for which data are available (see Woitke et al. 2016, 2019; Kamp et al. 2017, for further details on the models). The underlying model assumes a parametric disk model, and for which the gas temperatureis self-consistently calculated considering the balance between cooling and heating mechanisms for the gas. The resulting model fits the SED of the source and aims to reproduce the integrated flux from far-IR gas emission lines. The underlying disk structure is assumed to be smooth; however, to better fit SEDs at near to mid-IR wavelengths, models are adapted to include a dust (and gas) cavity if required. Generally, models have not been generated to account for dust gaps and rings as seen in spatially-resolved mm dust continuum images.
We use the gas density, gas temperature, and ionisation structure from the DIANA model of HD 97048. This model has a total disk (gas plus dust) mass of ≈0.1 M⊙. Assuming a global gas-to-dust mass ratio of ~100, this disk mass is consistent with the upper limit for the dust mass derived from the (sub)mm continuum emission observed with ALMA and corrected for the revised distance to the source (≲ 0.09 MJ; Walsh et al. 2016). The ionisation rate throughout the disk is the sum of both the cosmic-ray and X-ray ionisation rates. Maps of the disk physical structure as a function of disk radius and height are shown in Fig. 6. The best-fit DIANA model has acavity out to 65 au in both the gas and the dust and a small inner ring of gas and dust out to 6 au. We note here that the size of this cavity is greater than that observed with ALMA in the mm-dust continuum (≈50 au).
Due tochemistry, the abundance distribution of HCO+ will not have a constant value relative to the underlying gas density as is commonly assumed in parametric models. Following Aikawa et al. (2015), we analytically derive the HCO+ abundance, n(HCO+) cm−3, throughout the disk under a few acceptable and tested assumptions. Because the chemical timescale in a disk is significantly shorter thanthe disk lifetime we assume steady state, i.e.,
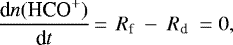
where Rf and Rd are the rates of HCO+ formation and destruction, respectively. The main formation reaction for HCO+ is via CO,

and the primary destruction reaction is recombination with an electron,

We ignore the destruction of HCO+ via grain-surface recombination as this is only dominant in the inner <10 au of the disk in the dense midplane where dust grains become the main charge carrier and we do not model this region of the disk. We also assume that HCO+ is the dominant cation in the molecular region of the disk as has been confirmed by full chemical models (e.g., Walsh et al. 2012; Aikawa et al. 2015). The resultant abundance of HCO+ is given by;
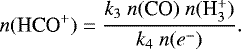
The reaction rate coefficients, ki, are given in Table 2, where i is the number of the reaction as compiled by Aikawa et al. (2015).
We parameterise the CO abundance distribution as described by Williams & Best (2014). CO is present in the disk with a relative abundance of n(CO)/nH = 1.4 × 10⁻⁴ if the temperature is greater than 20 K (the approximate freezeout temperature of CO) and if the vertical column density of H2 (integrated vertically downwards from the disk surface) is greater than 1.3 × 1021 cm−2. Here, nH is the total number density of hydrogen nuclei. This simple prescription takes into account the two primary destruction pathways for CO: freezeout onto dust grain surfaces in the midplane, and photodissociation in the atmosphere. The column density upper limit comes from modelling work by Visser et al. (2009) and observations of HD 163296 by Qi et al. (2011). The H and electron abundances are given by
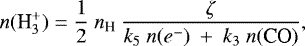
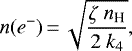
(Aikawa et al. 2015). Here ζ is the ionisation rate from the DIANA model. These equations are determined by solving the rate equations for each species under the steady state assumption.
The H13CO+ abundance is determined by simply assuming that H12CO+/H13CO+ = 12C/13C = 69 (e.g., Wilson 1999). Although isotope fractionation processes (e.g., fractionation reactions and isotope-selective photodissociation) will cause the 12CO/13CO and H12CO+/H13CO+ abundance ratios to vary throughout the disk (Woods & Willacy 2009), developing and running a full chemical model that includes fractionation is beyond the scope of this work and best addressed in a future dedicated study. In a previous study, Woods & Willacy (2009) show that the n(H12CO+)/n(H13CO+) ratio has a value of ≈40−60 in the layer in the inner disk (≲30 au) at which HCO+ reaches the highest fractional abundance (~10−9). The resulting abundance distributions as a function of disk radius and height for CO, HCO+ and H13CO+ are shown in Fig. 6.
Synthetic channel maps were generated using LIME version 1.6 (LIne Modelling Engine; Brinch & Hogerheijde 2010) using the molecular data files for HCO+ and H13CO+ from the LAMDA molecular database3. To check whether or not the assumption of LTE was appropriate, we calculated the critical density of the HCO+ J = 4−3 transition using the collisional rates from Flower (1999). The critical density was determined to be 106 cm−3 in the temperature range from to 30 to 100 K. In the region of the disk model where the HCO+ is present the gas density is above this value (see Fig. 6); therefore, it was confirmed that LTE is an appropriate assumption. The models were made using the same position and inclination angles of the source. The resulting image cubes were then smoothed to the same Gaussian beam as the HCO+ and H13CO+ observations. The simulated channel maps were used to generate azimuthally-averaged radial profiles from the resulting integrated intensity maps and then directly compared with the observations. For the H12CO+/H13CO+ integrated intensity ratio the images were smoothed to the same common beam as described for the observational dataset. We run a range of models step-by-step altering the initial model to find a best by-eye fit to the observed radial profiles. The specifics of the models are summarised in Table 3. The resulting modelled radial intensity profiles for HCO+ and H13CO+, and the line ratio, are shown in Fig. 7 where the coloured lines are the observations and the black lines are the models.
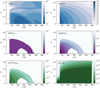 |
Fig. 6 Physical disk structure of the HD 97048 protoplanetary disk and results from the analytical chemical model. Quantities shown are the gas temperature (top left), total H nuclei number density (top right), CO number density relative to H nuclei (middle left), HCO+ number density relative to H nuclei (middle right), H13CO+ number density relative to H nuclei (bottom left) and the sum of the cosmic ray and X-ray ionisation rates (bottom right). |
Reaction rate coefficients from UMIST RATE12 (1) used in the analytical formula from Aikawa et al. (2015).
5.1 Fiducial model results
Model 1 is the fiducial model as described above and this model is found to overestimate the magnitude of the emission for both the HCO+ and H13CO+ lines. The difference between the modelled and observed peak flux for HCO+ and H13CO+ are around a factor of 1.3 and 2.4, respectively. The morphology of the modelled emission also does not match the observed profiles. The latter are centrally peaked whereas the modelled profiles peak in emission at ≈ 100 au. The resulting line ratio also does not exhibit the same radial behaviour as the observation as it increases radially from 6 to 26.
5.2 Modifications to the fiducial model
Since the fiducial model is a poor fit to the observations we now modify this model step by step in order to better reproduce the data. We first aim to fit the radial profiles beyond a radius of ≈100 au. In Model 2 the abundance of HCO+ was multiplied by a factor,  , of 0.2 relative to the abundance calculated using the analytical chemical model. This factor was determined by gradually reducing the multiplication factor in steps of 0.1 in each test, i.e., [0.9, 0.8,...], until an acceptable by-eye fit to the HCO+ was found. The multiplicative factor
  is additionally applied to the H13CO+ which alters the n(H12CO+)/n(H13CO+) ratio in the disk. For Model 2
  is 1 i.e. n(H12CO+)/n(H13CO+) is 69. A comparison with the observed profiles shows that good agreement with the radial integrated intensity profile for HCO+ emission is now obtained beyond 100 au. The overall decrease in abundance of a factor of 5 that is required here indicates that either the gas surface density is overestimated by this factor in the disk, or that the disk temperatureof the emitting layer is over-estimated, or that the analytical chemical model describing HCO+ is over-predicting the fractional abundance. However, in this model the H13CO+ peak flux is now under-predicted. The resulting H12CO+/H13CO+ integrated intensity ratio still does not exhibit the same radial behaviour as the observations and is increasing radially from 16 to 44.
Next we try to reconcile the HCO+ model and observations in the inner disk and apply the same changes to the H13CO+ in order to retain their abundance ratio throughout. In Model 3 we modify the disk structure by hand to include gas in the cavity from ≈ 6 to ≈ 65 au. The gas density, temperature, and molecular abundances within the cavity are set equal to the values at the inneredge of the model gas disk. An LTE model with gas in the cavity and with 0.2 times the HCO+ abundance (ηcavity) used in Model 2 reproduces well the observed radial profile (see Fig. 7). The continued disagreement with the H13CO+ observations and models shows that the initial assumption of a globally constant value for n(H12CO+)/n(H13CO+) of 69 may not be appropriate.
For the H13CO+, further modifications to this model are required to better reproduce the observations. We alter the disk n(H12CO+)/n(H13CO+) abundance ratio globally by increasing n(H13CO+) relative to the values in Model 3. The best by-eye fit for  was found to be 2 relative to the abundances in Model 2. This results in a global disk n(H12CO+)/n(H13CO+) abundance ratio of 35. This is not unrealistic as chemical models that include chemical isotope fractionation processes do predict a decrease in n(12CO)/n(13CO) and n(H12CO+)/n(H13CO+) by at most a factor of two in the midplane (Woods & Willacy 2009; Miotello et al. 2014). This model provides a much improved fit in the inner disk within 200 au in the H13CO+, but there is still not enough H13CO+ emission in the outer disk.
In Model 5 we decrease the n(H12CO+)/n(H13CO+) ratio in the outer disk (>200 au) further to try and fit the H13CO+ observations. The best by-eye fit for  was found to be 6 relative to the abundances in Model 2 resulting in a n(H12CO+)/n(H13CO+) ratio of 14 in the outer disk. This suggests the presence of two carbon chemical fractionation regimes, traced in H13CO+ in the HD 97048 disk. The feasibility of this scenario and possible explanations will be discussed in Sect. 6.3.
We also show the residual channel maps (observations minus Model 5) in Appendix C for HCO+ and H13CO+, respectively.From the channel maps we are primarily under-predicting (purple contours) the flux from the HCO+ line despite the reasonably good fit to the integrated intensity profile. These residuals may be due to the model emission originating from a lower height in the disk than the observations. This would mean that the HCO+ gas is optically thick higher in the disk than our model predicts such that the model is either underestimating the disk temperature and hence the disk scale height (i.e., it is more flared than predicted), or that the disk is more massive than suggested by the DIANA model. The H13CO+ residuals are insignificant.
We also checked the impact on the modelled line emission when including the effect of dust opacity. The aim was to check whether or not this arises in a suppression of emission in the inner region. We assumed a gas-to-dust mass ratio of 100 and used the dust opacity table from Ossenkopf & Henning (1994) assuming 106 yr of coagulation and thick ice mantles. This is reasonable for the age of this disk (≈ 3 Myr, Lagage et al. 2006). The continuum was subtracted from the model images using the CASA function imcontsub. The resulting radial profiles differed by 10–20% only from the models where we neglect dust opacity and thus are within the errors of the data. Hence, the emission in the inner disk is not significantly suppressed due to dust opacity. The explanation for this is likely because we are not resolving molecular emission from the innermost region where dust opacity has the maximal impact on the emergent line emission (e.g., Öberg et al. 2015; Isella et al. 2016).
To investigate the effect of the gas temperature on the HCO+ and H13CO+ line emission we ran a set of exploratory models. We found that reducing the gas temperature by a factor of 2 throughout the disk led to a good by-eye fit to the observations in the inner disk (<200 au) using the canonical abundance ratio. However, a significant increase in the H13CO+ abundance relative to HCO+ in the outer disk is still required to better reproduce the emission here. This supports our claim of the presence of two carbon fractionation regimes in this protoplanetary disk, and also supports enhanced fractionation in the outer disk due to the disk being colder than previously inferred from previous modelling work. A more robust determination of the gas temperature structure of this source will require high spatial resolution observations of multiple lines of molecular tracers of gas temperature.
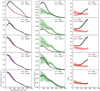 |
Fig. 7 Deprojected and azimuthally-averaged radial integrated intensity profiles for HCO+, H13CO+ and the HCO+/H13CO+ ratio from the observations (in colour) and the LIME models (black). The coloured shaded region on each profile represents the errors (see text for details). The specifics of each model are detailed in Table 3 and Sect. 5. |
6 Discussion
We have presented the first detections of H13CO+ and HC15N in the HD 97048 protoplanetary disk. We compare the radial emission profiles of these tracers with the mm continuum emission profile and the line emission from CO and HCO+. We find that the optically thin tracers, H13CO+ and HC15N, appear to exhibit radial variations in their integrated intensity profiles in contrast to the optically thick tracers, CO and HCO+. Contrary to the H13CO+ J = 4−3 data, the H13CO+ J = 4−3 radial intensity profile shows a step-like radial structure. The H12CO+/H13CO+ intensity ratio across the disk is constant with an average value of 12 ± 3. This value is consistent with observations of other disks where the disk-integrated H12CO+/H13CO+ (J = 3−2) flux ratios range from 13 to 25 (Öberg et al. 2010, 2011; Huang et al. 2017). This low ratio (<69) is consistent with optically thick HCO+ emission. However, consideration of optical depth effects alone cannot explain the data. We have shown that radial variations in the abundance ratio of H12CO+ to H13CO+ are necessary to explain the radial behaviour in the observed intensity ratio. We find one model that provides good by-eyefit to the data. In Model 5 we require an enhancement relative to the canonical ratio of H13CO+ to H12CO+ by a factor of 2 in the inner disk (<200 au) and 5 in the outer disk (>200 au).
The HC15N intensity profile appears to peak in a ring which appears to match well with the mm-sized dust distribution at the same spatial resolution. Higher spatial resolution observations are required to confirm this association. Without complementary observations of the main isotopologue, HCN, it is difficult to investigate further the origin of the HC15N emission. However, we can rule out suppression of line emission by the dust opacity in the inner disk, within the first dust ring, as the potential origin of a molecular ring.
In the remainder of this section, we explore if isotope-selective chemistry can explain the structure seen in the H13CO+ emission profile and H12CO+/H13CO+ ratio across the disk. We also make an estimate on the level of gas depletion in the inner cavity of the disk, compare our observations with those towards other Herbig Ae/Be disks, and speculate on alternative physical/chemical processes that could explain our results.
6.1 Can isotope-selective chemistry explain the H13CO+ emission?
Our best fit model requires multiple H12CO+/H13CO+ fractionation regimes. Isotope selective chemistry could be responsible for the radial intensity profile of the H13CO+ emission and the observed H12CO+/H13CO+ ratio but chemical models with isotope selective chemistry only predict a change in the H12CO+/H13CO+ ratio over very narrow radial and vertical regions of the disk. While detailed chemical modelling of this is beyond the scope of this work, we explore how isotope selective chemistry could influence the emergent HCO+ and H13CO+ line emission.
Isotope selective photodissociation enhances the ratio of 12CO/13CO in the disk atmosphere due to the different self-shielding column densities of the different isotopologues (Visser et al. 2009; Miotello et al. 2014). The relative abundances of 12CO and 13CO are the least affected of the different CO isotopologues since they are the most abundant. However, the shielding column for 13CO will be reached slightly deeper into the disk atmosphere than that for 12CO (Miotello et al. 2014). Hence, there will exist a layer in the disk surface where 12CO/13CO > 69 such that H12CO+/H13CO+ is also >69 due to the coupled chemistry between the two species. In the model of a T Tauri disk in Miotello et al. (2014) that includes comprehensive isotope-selective chemistry, the peak abundance ratio for 12CO/13CO is only ≈2 × the underlying elemental ratio and only in a narrow layer of the disk atmosphere. The models of carbon isotope fractionation in the inner 30 au of a T Tauri disk by Woods & Willacy (2009) show that there is an increase in the isotopologue ratio in HCO+ relative to that for CO in the more tenuous and irradiated disk atmosphere (i.e.,  with a maximum n(H12CO+)∕n(H13CO+) of ≈110). However, this cannot explain the results for HD 97048 because isotope selective photodissociation leads to an enhancement of the main isotopologue relative to the rare isotopologue, which acts in the opposite direction to that required to explain our observations.
Additionally, there are isotope exchange reactions which enhance the abundance of 13CO relative to 12CO and H13CO+ relative to H12CO+ at low temperatures, <35 and <9 K respectively (as measured by Smith & Adams 1980). Models of the carbon isotope fractionation in protoplanetary disks show that the chemical HCO+ fractionation follows the CO fractionation for warm temperatures >60 K but for lower temperatures the fractionation is more extreme for HCO+ than CO. In the Woods & Willacy (2009) models the 12CO/13CO reaches ≈40 in the disk midplane whereas the H13CO+/H12CO+ ratio is lower ≈30. Since the density is the disk is relatively high this process is roughly in chemical equilibrium and can be calculated as follows:
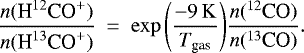
Figure 8 shows the n(H12CO+)∕n(H13CO+) ratio as a function of gas temperature and underling  ratio. The white contours mark the three n(H12CO+)∕n(H13CO+) ratios used in Models 1 to 3, 4 and 5 respectively. The dashed black line marks the lowest gas temperature in the disk model (≈16 K). This calculation shows us that the fractionation required in Model 4 is reasonable, but in order to reach the level of fractionation in Model 5, depending on the underlying
 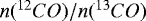 ratio, the gas temperature needs to be between 5 and 10 K and this is less than the minimum gas temperature in the disk model. For chemical fractionation to explain our results the gas temperature in the outer disk needs to be significantly cooler than current models predict.
The radial abundance profiles for our best-fit models for the HCO+ and H13CO+ emission shows that isotope-selective processes are occurring in this disk; however, the enhancement factors required for H13CO+ are needed across a significantly larger column density of the disk compared to predictions from models, and we need a radial change in the ratio. Comprehensive chemical models are required to determine if the H12CO+/H13CO+ abundance ratio exhibits variations more than a factor of a few relative to the elemental ratio in the outer disk (100’s of au) and how the observed line emission will reflect this.
 |
Fig. 8 n(H12CO+)∕n(H13CO+) ratio as a function of gas temperature and underling |

6.2 Estimating the gas depletion in the cavity
We detect HCO+ emission in the channel maps down to at least 40 au whereas the model assumes a gas cavity size of 65 au. By adding gas to the cavity in Model 3 with an abundance 0.2 times that at the edge of the disk we can well reproduce the radial profile of the HCO+ emission. The fractional abundance of HCO+ in the dust cavity reaches a maximum value of 6 × 10⁻⁹. Chemical models showthat the HCO+ fractional abundance in the inner (<50 au) regions of full disks can be as high as 10−7 (Walsh et al. 2010; Aikawa et al. 2015). Hence, if we assume that this value represents an absolute ceiling value for the HCO+ fractional abundance then the gas surface density is ≈500 times less that in the dust cavity than in the inner edge of the outer disk. However, there remain caveats to this estimate related to chemistry. Because there is a central dust cavity in this disk then the gas will be less shielded from ionising radiation resulting in potentially higher HCO+ abundances than calculated in chemical models of disks without dust cavities. HCO+ is not an optimal tracer of gas mass; hence, the gas depletion in the cavity be should be estimated using CO isotopologue observations.
6.3 A comparison with other Herbig Ae/Be disks
Molecular line emission from Herbig Ae/Be disks has been shown to trace both sub-structure associated with an underlying ringed dust structure and radial structure that arises due to chemistry, such as snowlines (e.g., HD 163296, HD 169142: Qi et al. 2013, 2015; Mathews et al. 2013; Isella et al. 2016; Fedele et al. 2017; Carney et al. 2018). With ALMA we now have spatially resolved detections of the HCO+ and HCN isotopologues in multiple protoplanetary disks. Although these molecules are commonly detected in disks around T Tauri stars, e.g., IM Lup, AS 209, V 4046 Sgr, DM Tau, LkCa 15 (Piétu et al. 2007; Öberg et al. 2015; Guzmán et al. 2015, 2017; Huang et al. 2017), we will primarily discuss the detections towards HD 97048 in the context of other Herbig Ae/Be disksgiven the differences in chemistry expected between these two disk types (e.g., Walsh et al. 2015; Agúndez et al. 2018).
Both HCN and HCO+ have been detected towards the dust-trap-hosting transition disk around the Herbig Ae star, HD 142527 (Casassus et al. 2013, 2015a; Rosenfeld et al. 2014; van der Plas et al. 2014). However, for this source, the molecular emission is strongly influenced by the large cavity (140 au) and the lop-sided dust trap. The HCO+ emission from within the cavity traces non-Keplerian motions that have been attributed to radial flows through the gap (Casassus et al. 2013, 2015a; Rosenfeld et al. 2014), and the HCN emission is strongly anti-coincident with the dust trap. This anti-coincidence is proposed to be due to either the lower dust temperatures in the trap (leading to enhanced freezeout) or a high continuum optical depth in the dust trap that is suppressing the emergent line emission (van der Plas et al. 2014). The disk around HD 142527 is a clear example demonstrating the influence that extreme dust structure has on the emergent molecular emission. Emission from H13CO+ (J = 8−7) from HD 142527 has been targeted with ALMA; however, it was reported as a non-detection (Casassus et al. 2015b).
Evidence for multiple rings of H13CO+ have been detected in the HD 163296 disk and one ring of H13CO+ has been detected in the MWC 480 disk, but their relation to the underlying dust and/or gas structure has not yet been fully investigated using detailed models. (Huang et al. 2017). These observations have a spatial resolution of ≈60–70 au. In both of these sources there is a central cavity in the H13CO+ emission and this has been primarily attributed to optically thick continuum emission in the inner disk which suppresses the emergent line emission. For the specific case of H13CO+, this may also be partially due to chemistry in the inner disk. Depending on the location of the H2 O snowline, which can reside at ~10 s of au from the star in Herbig Ae/Be disks (e.g., Woitke et al. 2009; Notsu et al. 2017), gaseous H2 O may be present which facilitates another destruction pathway for HCO+. Hence, the absence of H13CO+ emission in the inner regions of protoplanetary disks and protostars has been proposed as an indirect indication of the radial location of the water snow line. This effect has yet to be conclusively demonstrated for a protoplanetary disk but has been demonstrated for the protostellar envelope encompassing NGC 1333-IRAS 2A (van ’t Hoff et al. 2018). As yet, there is no evidence for a central cavity strongly depleted in dust in neither HD 163296 nor MWC 480, unlike as has been found for HD 97048. This explains why the H13CO+ emission profile for HD 97048 is centrally peaked: the emergent emission is not suppressed due to the presence of a significant reservoir of mm-sized dust.
The first detection of HC15N in a protoplanetary disk was reported in the MWC 480 disk (Guzmán et al. 2015). In this source the HCN, H13CN and HC15N all show similar radial distributions which follow the smoothly decreasing dust emission profile. From the same study, HCN emission from the DM Tau disk, a T Tauri source, shows a second ring of emission beyond the mm-dust emission at ~ 300 au. The ring is proposed to arise from the result of increased photodissociation of HCN due to the depletion of micron sized dust interior to the detected molecular ring. The HC15N emission that we observe appears to follow the radial emission profile of the mm-dust to the spatial resolution of the observations. Observations of the main isotopologue HCN with improved spatial resolution in the HD 97048 disk are needed confirm the presence of rings in this tracer that align with the dust rings. The H13CN emission in the AS 209 disk, another T Tauri disk, is also ringed (Guzmán et al. 2017), and recent ALMA observations have shown clearly that this disk hasmultiple rings of dust (Fedele et al. 2018). This, again, is another example disk with rings of dust and rings of molecular gas. HC15N has since been detected in the HD 163296 disk but the observations are not of high enough S/N to make assertions about the radial distribution in relation to the dust rings (Guzmán et al. 2017). Nevertheless, there is growing evidence, including in the analysis presented here, that molecular line mission from optically thin tracers may be following, and is thus influenced by, the underlying dust distribution in Herbig Ae/Be disks making them interesting test cases.
As stated previously, the disk around Herbig Ae star, HD 100546, was also targeted in the same observing campaign during which the data reported here for HD 97048 were collected. HD 100546 has been shown to also host rings of mm-dust similar to HD 97048; however, the dust sculpting in HD 100546 is much more extreme with most of the (sub)mm emission arising from a narrow ring of dust centred at 26 au with a width of 21 au (Walsh et al. 2014; Pineda et al. 2019). This has been proposed to arise due to a combination of radial drift and the sequential formation of two giant planets in the disk (Pinilla et al. 2015). We do not detect neither H13CO+ nor HC15N in the disk around HD 100546. To date, there are no reported detections of HCN neither such that it is not currently possible to draw any concrete conclusions from the non-detections reported here for this species. Wright et al. (2015) report the detection of HCO+ J = 1−0 with ATCA towards HD 100546, so the non-detection of of the higher energy J = 4−3 transition of the isotopologue, H13CO+, is perhaps surprising, given that emission from the main isotopologue is expected to be optically thick. However, we have detected SO in this disk, proposed to be tracing either a disk wind or a circumplanetary disk (Booth et al. 2018). In contrast, we do not detect SO in the HD 97048 disk.
The differences between the molecular content of HD 97048 and HD 100546 may be explained by them being in different stages of evolution where HD 97048 is still forming planets whereas the HD 100546 is not. In support of this explanation, the same direct-imaging techniques have been used to search for the presence of planets in both sources; however, whilst there is a confirmed planet candidate in the HD 100546 disk, there are none yet confirmed to reside in the HD 97048 disk using direct imaging methods (e.g., Quanz et al. 2012, 2013). However, note the recent indirect detection of a few Jupiter mass planet at 130 au via kinematic analyses of the CO line emission (Pinte et al. 2019). This is a significantly lower mass planet than detected in HD 100546 that also appears to be undergoing accretion, which supports this hypothesis.
6.4 What is the effect of the ringed dust (and gas) structure on the chemistry?
We find that a radially smooth profile cannot fit the H13CO+ observations and the H12CO+/H13CO+ abundance ratio across the disk. As this is not wholly consistent with predictions from chemical fractionation models we now explore the possible effect of the dust rings on the disk chemistry.
From ALMA observations we know that the mm-sized dust is distributed in three rings (Walsh et al. 2016; van der Plas et al. 2017). Scattered light observations with SPHERE show that at the disk surface there are four rings, two of which are located at comparable positions to the mm-sized dust rings (Ginski et al. 2016). Due to the matching rings in both the mm-sized and micron-sized grains planet-disk interactions have been proposed as the best explanation for the dust rings in the HD 97048 disk (Walsh et al. 2016; Ginski et al. 2016; van der Plas et al. 2017). From the non-detections of direct emission from planets in the gaps and by comparing the observed rings to models, limits can be placed on the masses of the anticipated planets. van der Plas et al. (2017) estimated the mass of the inner-most planet, located between 2.5 and 11 au, to be ≈0.7 MJ guided by models from Rosotti et al. (2016). Low mass planets, ≈1 MJ, will create anarrower and shallower cavity in the gas surface density than in the mm-sized dust which forms more distinct rings (Zhu et al. 2012; de Juan Ovelar et al. 2013, 2016). Pinte et al. (2019) indirectly detect a planet of a few Jupiter masses at 130 au, which is consistent with upper-limits from VLT/SPHERE (Ginski et al. 2016). Hence, it is possible that perturbations in the gas surface density are sufficiently shallow that they are not visible in our CO and HCO+ isotopologueobservations, or conversely, that the gas gaps are deep, but also sufficiently narrow that subsequent chemical inhomogeneities are resolved out.
We explore here whether or not variations in the underlying gas density due to forming planets may be responsible for the observed radial variation in the H12CO+/H13CO+ abundance ratio across the disk. This is contrast to the scenario discussed in Sect. 6.1 (see Fig. 9a). Although our data do not have the resolution to resolve the proposed gas gaps, the presence of such gaps may be revealed through analysing global abundance ratios, that average over the chemical sub-structure. A drop in the column density of small dust grains at the location of the millimetre-sized dust gaps will provide less shielding from photodissociating and photoionising radiation. This will increase the ionisation fraction within the dust gaps relative to the dust rings. Given that HCO+ is the dominant cation in the molecular layer, its abundance may also increase in the dust gaps and this may mask the presence of gas depletion therein because the overall column density of HCO+ may not change significantly. In this case the difference between the HCO+ and H13CO+ abundance distributions would only be due to isotope-selective chemistry (Fig. 9b). Also, because of the non-linear nature of the chemistry, a reduction in gas density can have a profound effect on the abundances of more minor species because the rates of two-body ion-molecule reactions are proportional to n2. Hence, it is possible that this can amplify the effects of isotope-selective photodissociation by e.g., slowing down the reformation of 13CO relative to 12CO. This would reduce the abundance of H13CO+ relative to HCO+ in the disk, in contrast to our observations (Fig. 9c).
An additional explanation to consider is the effect of the dust structure on the gas temperature. Models show that the gas temperature relative to the dust temperature can decrease in the disk atmosphere due to grain growth and settling and, at the location of the dust gaps (Facchini et al. 2017; van der Marel et al. 2018). A decrease in gas temperature could be traced by isotope fractionation (see Fig. 9d) but this remains speculation until dedicated physico-chemical models are available that include isotope-selective chemistry as well as ringed dust structure.
7 Conclusion
The observations of disks around Herbig Ae/Be stars with ALMA so far have shown the incredible potential of these sources as laboratories to study giant planet formation. With ALMA, we have shown for the first time that the disk molecules H13CO+ and HC15N, are may be tracing sub-structure in the HD 97048 protoplanetary disk. Our favoured by-eye fit to the H13CO+ observationsrequire a model with an enhancement in fractional abundance relative to the canonical isotope ratio in the outer disk. Since the HCO+ models do not require such enhancement factors, chemical fractionation is the simplest explanation for the emergent line emission. The enhancement in H13CO+ relative to HCO+ can be explained by a cold reservoir of gas in the outer disk (≲10 K, ≳200 au). Through a comparison with disk models that include carbon fractionation we argue that isotope selective chemistry cannot solely explain the observations and we discuss the effects of the ringed dust, and possible ringed gas, on the disk thermal and chemical structure onthe interpretation of observations.
Gas giant planets on wide orbits are the potential exoplanet population currently probed with ALMA via the ringed depletion of continuum emission. As disks around Herbig Ae stars are the progenitors to multiple gas giant systems (e.g. HR 8799 Marois et al. 2008) studying these disks is of great importance. These new detections further motivate and highlight the need for future studies on the distribution of molecular gas in these planet-forming disks. Future ALMA observations of HD 97048 need to have the spatial resolution to properly resolve the ringed structure in the dust and in the different gastracers, and will allow for the determination of the size of central cavity in different tracers. This will enable a detailed study on the dominant chemical processes in the disk and allow us to make clearer distinctions between thedifferent scenarios we have presented. For further progress in this field disk models that accurately represent the dust and gas distribution in disks are necessary. Specifically, models which take into account the gas within the dust cavity and the multiple rings of gas and dust depletion. Such models will maximise the power of molecular line emission to provide much needed information on the physical and chemical conditions in planet-forming disks.
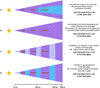 |
Fig. 9 Cartoon illustrating the possible gas and dust distributions in the HD 97048 disk. The mm-sized dust is represented by brown circles, the micron-sized dust is represented by grey circles, the gas and depleted gas are represented by purple and lilac respectively and the light blue corresponds to a cold gas reservoir. |
Acknowledgements
We thank the referee for their constructive report. This paper makes use of the following ALMA data: ADS/JAO.ALMA#2011.0.00863.S and 2012.1.00031.S. ALMA is a partnership of ESO (representing its member states), NSF (USA) and NINS (Japan), together with NRC (Canada), NSC and ASIAA (Taiwan), and KASI (Republic of Korea), in co-operation with the Republic of Chile. The Joint ALMA Observatory is operated by ESO, AUI/NRAO and NAOJ. A.B. acknowledges the studentship funded by the Science and Technology Facilities Council of the United Kingdom (STFC). C.W. acknowledges funds from the University of Leeds. J.D.I. and C.W. acknowledge support from the STFC under ST/R000549/1.
Appendix A H13CO+ and HC15N channel maps
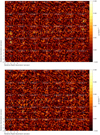 |
Fig. A.1 H13CO+(top) and HC15N (bottom) channel maps with a velocity resolution of 0.5 km s−1. The rms for each map are 0.011 Jy beam−1 km s−1 channel−1 and 0.012 Jy beam−1 km s−1 channel−1, respectively. Emission is detected in each map with a S/N of 6.8 and 5.7, respectively. The black contours are at the 3 and 5σ level. The grey dashed contour shows the Keplerian mask used and the dotted white lines mark the major and minor axes of the disk. |
Appendix B HCO+ and H13CO+ residual channel maps
 |
Fig. B.1 Residual (data–model) HCO+ (top) and H13CO+ (bottom) channel maps at a velocity resolution of 0.21 km s−1. The rms is 0.016 Jy beam−1 km s−1 channel−1 the purple and green contours are ±3, 5, 7σ, respectively. |
References
- Acke, B., & van den Ancker, M. E. 2006, A&A, 449, 267 [NASA ADS] [CrossRef] [EDP Sciences] [Google Scholar]
- Agúndez, M., Roueff, E., Le Petit, F., & Le Bourlot, J. 2018, A&A, 616, A19 [NASA ADS] [CrossRef] [EDP Sciences] [Google Scholar]
- Aikawa, Y., Furuya, K., Nomura, H., & Qi, C. 2015, ApJ, 807, 120 [NASA ADS] [CrossRef] [Google Scholar]
- ALMA Partnership (Brogan, C. L., et al.) 2015, ApJ, 808, L3 [NASA ADS] [CrossRef] [Google Scholar]
- Andrews, S. M., Huang, J., Pérez, L. M., et al. 2018, ApJ, 869, L41 [NASA ADS] [CrossRef] [Google Scholar]
- Boehler, Y., Weaver, E., Isella, A., et al. 2017, ApJ, 840, 60 [NASA ADS] [CrossRef] [Google Scholar]
- Booth, A. S., Walsh, C., Kama, M., et al. 2018, A&A, 611, A16 [NASA ADS] [CrossRef] [EDP Sciences] [Google Scholar]
- Booth, A. S., Walsh, C., Ilee, J. D., et al. 2019b, ApJL, in press [arXiv:1908.05045] [Google Scholar]
- Brinch, C., & Hogerheijde, M. R. 2010, A&A, 523, A25 [NASA ADS] [CrossRef] [EDP Sciences] [Google Scholar]
- Carmona, A., van der Plas, G., van den Ancker, M. E., et al. 2011, A&A, 533, A39 [NASA ADS] [CrossRef] [EDP Sciences] [Google Scholar]
- Carney, M. T., Fedele, D., Hogerheijde, M. R., et al. 2018, A&A, 614, A106 [NASA ADS] [CrossRef] [EDP Sciences] [Google Scholar]
- Casassus, S., van der Plas, G. M. S. P., et al. 2013, Nature, 493, 191 [NASA ADS] [CrossRef] [Google Scholar]
- Casassus, S., Marino, S., Pérez, S., et al. 2015a, ApJ, 811, 92 [NASA ADS] [CrossRef] [Google Scholar]
- Casassus, S., Wright, C. M., Marino, S., et al. 2015b, ApJ, 812, 126 [NASA ADS] [CrossRef] [Google Scholar]
- Cazzoletti, P., van Dishoeck, E. F., Visser, R., Facchini, S., & Bruderer, S. 2018, A&A, 609, A93 [NASA ADS] [CrossRef] [EDP Sciences] [Google Scholar]
- Chapillon, E., Guilloteau, S., Dutrey, A., Piétu, V., & Guélin, M. 2012, A&A, 537, A60 [NASA ADS] [CrossRef] [EDP Sciences] [Google Scholar]
- Cleeves, L. I., Bergin, E. A., & Adams, F. C. 2014, ApJ, 794, 123 [NASA ADS] [CrossRef] [Google Scholar]
- Cleeves, L. I., Bergin, E. A., Qi, C., Adams, F. C., & Öberg, K. I. 2015, ApJ, 799, 204 [NASA ADS] [CrossRef] [Google Scholar]
- de Juan Ovelar, M., Min, M., Dominik, C., et al. 2013, A&A, 560, A111 [NASA ADS] [CrossRef] [EDP Sciences] [Google Scholar]
- de Juan Ovelar, M., Pinilla, P., Min, M., Dominik, C., & Birnstiel, T. 2016, MNRAS, 459, L85 [NASA ADS] [CrossRef] [Google Scholar]
- Doering, R. L., Meixner, M., Holfeltz, S. T., et al. 2007, AJ, 133, 2122 [NASA ADS] [CrossRef] [Google Scholar]
- Drabek-Maunder, E., Mohanty, S., Greaves, J., et al. 2016, ApJ, 833, 260 [NASA ADS] [CrossRef] [Google Scholar]
- Dutrey, A., Guilloteau, S., & Guelin, M. 1997, A&A, 317, L55 [NASA ADS] [Google Scholar]
- Facchini, S., Birnstiel, T., Bruderer, S., & van Dishoeck, E. F. 2017, A&A, 605, A16 [NASA ADS] [CrossRef] [EDP Sciences] [Google Scholar]
- Favre, C., Fedele, D., Maud, L., et al. 2019, ApJ, 871, 107 [NASA ADS] [CrossRef] [Google Scholar]
- Fedele, D., Bruderer, S., van Dishoeck, E. F., et al. 2013, A&A, 559, A77 [NASA ADS] [CrossRef] [EDP Sciences] [Google Scholar]
- Fedele, D., Carney, M., Hogerheijde, M. R., et al. 2017, A&A, 600, A72 [NASA ADS] [CrossRef] [EDP Sciences] [Google Scholar]
- Fedele, D., Tazzari, M., Booth, R., et al. 2018, A&A, 610, A24 [NASA ADS] [CrossRef] [EDP Sciences] [Google Scholar]
- Flower, D. R. 1999, MNRAS, 305, 651 [NASA ADS] [CrossRef] [Google Scholar]
- Füri, E., & Marty, B. 2015, Nat. Geosci., 8, 515 [NASA ADS] [CrossRef] [Google Scholar]
- Gaia Collaboration (Brown, A. G. A., et al.) 2018, A&A, 616, A1 [NASA ADS] [CrossRef] [EDP Sciences] [Google Scholar]
- Ginski, C., Stolker, T., Pinilla, P., et al. 2016, A&A, 595, A112 [NASA ADS] [CrossRef] [EDP Sciences] [Google Scholar]
- Guilloteau, S., Dutrey, A., & Simon, M. 1999, A&A, 348, 570 [NASA ADS] [Google Scholar]
- Guzmán, V. V., Öberg, K. I., Loomis, R., & Qi, C. 2015, ApJ, 814, 53 [NASA ADS] [CrossRef] [Google Scholar]
- Guzmán, V. V., Öberg, K. I., Huang, J., Loomis, R., & Qi, C. 2017, ApJ, 836, 30 [NASA ADS] [CrossRef] [Google Scholar]
- Hily-Blant, P., Magalhaes, V., Kastner, J., et al. 2017, A&A, 603, L6 [NASA ADS] [CrossRef] [EDP Sciences] [Google Scholar]
- Huang, J., Öberg, K. I., Qi, C., et al. 2017, ApJ, 835, 231 [NASA ADS] [CrossRef] [Google Scholar]
- Huang, J., Andrews, S. M., Dullemond, C. P., et al. 2018, ApJ, 869, L42 [NASA ADS] [CrossRef] [Google Scholar]
- Isella, A., Guidi, G., Testi, L., et al. 2016, Phys. Rev. Lett., 117, 251101 [NASA ADS] [CrossRef] [Google Scholar]
- Kamp, I., Thi,W.-F., Woitke, P., et al. 2017, A&A, 607, A41 [NASA ADS] [CrossRef] [EDP Sciences] [Google Scholar]
- Kastner, J. H., Zuckerman, B., Weintraub, D. A., & Forveille, T. 1997, Science, 277, 67 [NASA ADS] [CrossRef] [PubMed] [Google Scholar]
- Lagage, P.-O., Doucet, C., Pantin, E., et al. 2006, Science, 314, 621 [NASA ADS] [CrossRef] [PubMed] [Google Scholar]
- Loomis, R. A., Öberg, K. I., Andrews, S. M., & MacGregor, M. A. 2017, ApJ, 840, 23 [NASA ADS] [CrossRef] [Google Scholar]
- Maaskant, K. M., Honda, M., Waters, L. B. F. M., et al. 2013, A&A, 555, A64 [NASA ADS] [CrossRef] [EDP Sciences] [Google Scholar]
- Marois, C., Macintosh, B., Barman, T., et al. 2008, Science, 322, 1348 [NASA ADS] [CrossRef] [PubMed] [Google Scholar]
- Marty, B., Chaussidon, M., Wiens, R. C., Jurewicz, A. J. G., & Burnett, D. S. 2011, Science, 332, 1533 [NASA ADS] [CrossRef] [Google Scholar]
- Mathews, G. S., Klaassen, P. D., Juhász, A., et al. 2013, A&A, 557, A132 [NASA ADS] [CrossRef] [EDP Sciences] [Google Scholar]
- McElroy, D., Walsh, C., Markwick, A. J., et al. 2013, A&A, 550, A36 [NASA ADS] [CrossRef] [EDP Sciences] [Google Scholar]
- Meeus, G., Montesinos, B., Mendigutía, I., et al. 2012, A&A, 544, A78 [NASA ADS] [CrossRef] [EDP Sciences] [Google Scholar]
- Meeus, G., Salyk, C., Bruderer, S., et al. 2013, A&A, 559, A84 [NASA ADS] [CrossRef] [EDP Sciences] [Google Scholar]
- Miotello, A., Bruderer, S., & van Dishoeck, E. F. 2014, A&A, 572, A96 [NASA ADS] [CrossRef] [EDP Sciences] [Google Scholar]
- Nielsen, E. L., De Rosa, R. J., Macintosh, B., et al. 2019, AJ, 158, 13 [NASA ADS] [CrossRef] [Google Scholar]
- Notsu, S., Nomura, H., Ishimoto, D., et al. 2017, ApJ, 836, 118 [NASA ADS] [CrossRef] [Google Scholar]
- Öberg, K. I., Qi, C., Fogel, J. K. J., et al. 2010, ApJ, 720, 480 [NASA ADS] [CrossRef] [Google Scholar]
- Öberg, K. I., Qi, C., Fogel, J. K. J., et al. 2011, ApJ, 734, 98 [NASA ADS] [CrossRef] [Google Scholar]
- Öberg, K. I., Furuya, K., Loomis, R., et al. 2015, ApJ, 810, 112 [NASA ADS] [CrossRef] [Google Scholar]
- Ossenkopf, V., & Henning, T. 1994, A&A, 291, 943 [NASA ADS] [Google Scholar]
- Piétu, V., Dutrey, A., & Guilloteau, S. 2007, A&A, 467, 163 [NASA ADS] [CrossRef] [EDP Sciences] [Google Scholar]
- Pineda, J. E., Szulágyi, J., Quanz, S. P., et al. 2019, ApJ, 871, 48 [NASA ADS] [CrossRef] [Google Scholar]
- Pinilla, P., Benisty, M., & Birnstiel, T. 2012, A&A, 545, A81 [NASA ADS] [CrossRef] [EDP Sciences] [Google Scholar]
- Pinilla, P., Birnstiel, T., & Walsh, C. 2015, A&A, 580, A105 [NASA ADS] [CrossRef] [EDP Sciences] [Google Scholar]
- Pinte, C., van der Plas, G., Menard, F., et al. 2019, Nat. Astron., in press [arXiv:1907.02538] [Google Scholar]
- Qi, C., D’Alessio, P., Öberg, K. I., et al. 2011, ApJ, 740, 84 [NASA ADS] [CrossRef] [Google Scholar]
- Qi, C., Öberg, K. I., & Wilner, D. J. 2013, ApJ, 765, 34 [NASA ADS] [CrossRef] [Google Scholar]
- Qi, C., Öberg, K. I., Andrews, S. M., et al. 2015, ApJ, 813, 128 [NASA ADS] [CrossRef] [Google Scholar]
- Quanz, S. P., Birkmann, S. M., Apai, D., Wolf, S., & Henning, T. 2012, A&A, 538, A92 [NASA ADS] [CrossRef] [EDP Sciences] [Google Scholar]
- Quanz, S. P., Amara, A., Meyer, M. R., et al. 2013, ApJ, 766, L1 [NASA ADS] [CrossRef] [Google Scholar]
- Reffert, S., Bergmann, C., Quirrenbach, A., Trifonov, T., & Künstler, A. 2015, A&A, 574, A116 [NASA ADS] [CrossRef] [EDP Sciences] [Google Scholar]
- Rosenfeld, K. A., Chiang, E., & Andrews, S. M. 2014, ApJ, 782, 62 [NASA ADS] [CrossRef] [Google Scholar]
- Rosotti, G. P., Juhasz, A., Booth, R. A., & Clarke, C. J. 2016, MNRAS, 459, 2790 [NASA ADS] [CrossRef] [Google Scholar]
- Salinas, V. N., Hogerheijde, M. R., Mathews, G. S., et al. 2017, A&A, 606, A125 [NASA ADS] [CrossRef] [EDP Sciences] [Google Scholar]
- Schöier, F. L., van der Tak, F. F. S., van Dishoeck, E. F., & Black, J. H. 2005, A&A, 432, 369 [NASA ADS] [CrossRef] [EDP Sciences] [Google Scholar]
- Smith, D., & Adams, N. G. 1980, ApJ, 242, 424 [NASA ADS] [CrossRef] [Google Scholar]
- Teague, R., Semenov, D., Guilloteau, S., et al. 2015, A&A, 574, A137 [NASA ADS] [CrossRef] [EDP Sciences] [Google Scholar]
- Teague, R., Guilloteau, S., Semenov, D., et al. 2016, A&A, 592, A49 [NASA ADS] [CrossRef] [EDP Sciences] [Google Scholar]
- Thi, W.-F., van Zadelhoff, G.-J., & van Dishoeck, E. F. 2004, A&A, 425, 955 [NASA ADS] [CrossRef] [EDP Sciences] [Google Scholar]
- van den Ancker, M. E., de Winter, D., Tjin, A, & Djie, H. R. E. 1998, A&A, 330, 145 [NASA ADS] [Google Scholar]
- van der Marel,N., van Dishoeck, E. F., Bruderer, S., Pérez, L., & Isella, A. 2015, A&A, 579, A106 [NASA ADS] [CrossRef] [EDP Sciences] [Google Scholar]
- van der Marel, N., van Dishoeck, E. F., Bruderer, S., et al. 2016, A&A, 585, A58 [NASA ADS] [CrossRef] [EDP Sciences] [Google Scholar]
- van der Marel, N., Williams, J. P., & Bruderer, S. 2018, ApJ, 867, L14 [Google Scholar]
- van der Plas, G., van den Ancker, M. E., Acke, B., et al. 2009, A&A, 500, 1137 [NASA ADS] [CrossRef] [EDP Sciences] [Google Scholar]
- van der Plas, G., Casassus, S., Ménard, F., et al. 2014, ApJ, 792, L25 [Google Scholar]
- van der Plas, G., van den Ancker, M. E., Waters, L. B. F. M., & Dominik, C. 2015, A&A, 574, A75 [NASA ADS] [CrossRef] [EDP Sciences] [Google Scholar]
- van der Plas, G., Wright, C. M., Ménard, F., et al. 2017, A&A, 597, A32 [NASA ADS] [CrossRef] [EDP Sciences] [Google Scholar]
- van Leeuwen, F. 2007, A&A, 474, 653 [NASA ADS] [CrossRef] [EDP Sciences] [Google Scholar]
- van ’t Hoff, M. L. R., Persson, M. V., Harsono, D., et al. 2018, A&A, 613, A29 [NASA ADS] [CrossRef] [EDP Sciences] [Google Scholar]
- van Zadelhoff, G.-J., van Dishoeck, E. F., Thi, W.-F., & Blake, G. A. 2001, A&A, 377, 566 [NASA ADS] [CrossRef] [EDP Sciences] [Google Scholar]
- Vioque, M., Oudmaijer, R. D., Baines, D., Mendigutía, I., & Pérez-Martínez, R. 2018, A&A, 620, A128 [NASA ADS] [CrossRef] [EDP Sciences] [Google Scholar]
- Visser, R., van Dishoeck, E. F., & Black, J. H. 2009, A&A, 503, 323 [NASA ADS] [CrossRef] [EDP Sciences] [Google Scholar]
- Walsh, C., Juhász, A., Pinilla, P., et al. 2014, ApJ, 791, L6 [NASA ADS] [CrossRef] [Google Scholar]
- Walsh, C., Juhász, A., Meeus, G., et al. 2016, ApJ, 831, 200 [NASA ADS] [CrossRef] [Google Scholar]
- Walsh, C., Millar, T. J., & Nomura, H. 2010, ApJ, 722, 1607 [NASA ADS] [CrossRef] [Google Scholar]
- Walsh, C., Nomura, H., Millar, T. J., & Aikawa, Y. 2012, ApJ, 747, 114 [NASA ADS] [CrossRef] [Google Scholar]
- Walsh, C., Nomura, H., & van Dishoeck, E. 2015, A&A, 582, A88 [NASA ADS] [CrossRef] [EDP Sciences] [Google Scholar]
- Williams, J. P., & Best, W. M. J. 2014, ApJ, 788, 59 [NASA ADS] [CrossRef] [Google Scholar]
- Wilson, T. L. 1999, Rep. Prog. Phys, 62, 143 [NASA ADS] [CrossRef] [Google Scholar]
- Woitke, P., Thi, W.-F., Kamp, I., & Hogerheijde, M. R. 2009, A&A, 501, L5 [NASA ADS] [CrossRef] [EDP Sciences] [Google Scholar]
- Woitke, P., Min, M., Pinte, C., et al. 2016, A&A, 586, A103 [NASA ADS] [CrossRef] [EDP Sciences] [Google Scholar]
- Woitke, P., Kamp, I., Antonellini, S., et al. 2019, PASP, 131, 064301 [NASA ADS] [CrossRef] [Google Scholar]
- Woods, P. M., & Willacy, K. 2009, ApJ, 693, 1360 [NASA ADS] [CrossRef] [Google Scholar]
- Wright, C. M., Maddison, S. T., Wilner, D. J., et al. 2015, MNRAS, 453, 414 [NASA ADS] [CrossRef] [Google Scholar]
- Yen, H.-W., Koch, P. M., Liu, H. B., et al. 2016, ApJ, 832, 204 [NASA ADS] [CrossRef] [Google Scholar]
- Zhang, K., Bergin, E. A., Blake, G. A., et al. 2016, ApJ, 818, L16 [NASA ADS] [CrossRef] [Google Scholar]
- Zhang, K., Bergin, E. A., Blake, G. A., Cleeves, L. I., & Schwarz, K. R. 2017, Nat. Astron., 1, 0130 [NASA ADS] [CrossRef] [Google Scholar]
- Zhu, Z., Nelson, R. P., Dong, R., Espaillat, C., & Hartmann, L. 2012, ApJ, 755, 6 [NASA ADS] [CrossRef] [Google Scholar]
Publicly available on GitHub at https://github.com/kevin-flaherty/ALMA-Disk-Code/blob/master/makemask.py
The full DIANA models are publicly available: http://www-star.st-and.ac.uk/~pw31/DIANA/DIANAstandard/
LAMDA data files are available online at: http://home.strw.leidenuniv.nl/~moldata/
All Tables
ALMA Band 7 observations and detected molecular lines in the HD 97048 protoplanetary disk.
Reaction rate coefficients from UMIST RATE12 (1) used in the analytical formula from Aikawa et al. (2015).
All Figures
|
Fig. 1 HCO+ (top) and H13CO+ (bottom) channel maps with a velocity resolution of 0.21 km s−1. The rms noise, σ, is 0.016 Jy beam−1 per channel in both maps and the emission is detected with a S/N of 25 and 7, respectively. The grey dashed contour shows the Keplerian mask used and the dotted white lines mark the major and minor axes of the disk. |
| In the text | |
|
Fig. 2 Integrated intensity maps (left) and intensity-weighted velocity (right) for the HCO+ J = 4− 3 (top), H13CO+ J = 4− 3 (middle) and HC15N J = 4− 3 (bottom) transitions generated using the Keplerian masks shown in Figs. 1 and A.1. The S/N of the integrated intensity maps are 20, 3 and 3, respectively. The intensity-weighted velocity maps were made using a 3σ clip in the channel maps. The dotted white lines mark the major and minor axes of the disk. |
| In the text | |
|
Fig. 3 Line profiles of the H13CO+ (left) and HC15N (right) emission at a velocity resolution of 0.5 km s−1 and mirrored about the source velocity. The H13CO+ line profile isextracted from within the region encompassing the 3σ extent of the HCO+ integrated intensity and the HC15N extraction region is an ellipse centred on source and chosen by eye. The residuals from the mirrored line profiles are also shown. |
| In the text | |
|
Fig. 4 Deprojected and azimuthally-averaged radial profiles of the continuum emission, and CO, HCO+, H13CO+, HC15N line emission ratio (from top to bottom, then left to right). The coloured shaded region on each profile represents the errors (see text for details). The vertical dashed grey lines highlight the rings and gaps in the mm-dust continuum profile and the dashed grey profile is the best-fit model of the continuum uv data from (Walsh et al. 2016) and is normalised to the peak value in each plot. The dotted black line on the HC15N plot is the continuum model convolved with a 50 au beam from Walsh et al. (2016) and is normalised to the peak value in each plot. |
| In the text | |
|
Fig. 5 Deprojected and azimuthally-averaged radial profiles of the HCO+ and H13CO+ line emissionsmoothed to a common beam and the subsequent HCO+/H13CO+ ratio (from left to right). The coloured shaded region on each profile represents the errors (see text for details). The vertical dashed grey lines highlight the rings and gaps in the mm-dust continuum profile and the dashed grey profile is the best-fit model of the continuum uv data from Walsh et al. (2016) and is normalised to the peak value in each plot. |
| In the text | |
|
Fig. 6 Physical disk structure of the HD 97048 protoplanetary disk and results from the analytical chemical model. Quantities shown are the gas temperature (top left), total H nuclei number density (top right), CO number density relative to H nuclei (middle left), HCO+ number density relative to H nuclei (middle right), H13CO+ number density relative to H nuclei (bottom left) and the sum of the cosmic ray and X-ray ionisation rates (bottom right). |
| In the text | |
|
Fig. 7 Deprojected and azimuthally-averaged radial integrated intensity profiles for HCO+, H13CO+ and the HCO+/H13CO+ ratio from the observations (in colour) and the LIME models (black). The coloured shaded region on each profile represents the errors (see text for details). The specifics of each model are detailed in Table 3 and Sect. 5. |
| In the text | |
|
Fig. 8 n(H12CO+)∕n(H13CO+) ratio as a function of gas temperature and underling |
| In the text | |
|
Fig. 9 Cartoon illustrating the possible gas and dust distributions in the HD 97048 disk. The mm-sized dust is represented by brown circles, the micron-sized dust is represented by grey circles, the gas and depleted gas are represented by purple and lilac respectively and the light blue corresponds to a cold gas reservoir. |
| In the text | |
|
Fig. A.1 H13CO+(top) and HC15N (bottom) channel maps with a velocity resolution of 0.5 km s−1. The rms for each map are 0.011 Jy beam−1 km s−1 channel−1 and 0.012 Jy beam−1 km s−1 channel−1, respectively. Emission is detected in each map with a S/N of 6.8 and 5.7, respectively. The black contours are at the 3 and 5σ level. The grey dashed contour shows the Keplerian mask used and the dotted white lines mark the major and minor axes of the disk. |
| In the text | |
|
Fig. B.1 Residual (data–model) HCO+ (top) and H13CO+ (bottom) channel maps at a velocity resolution of 0.21 km s−1. The rms is 0.016 Jy beam−1 km s−1 channel−1 the purple and green contours are ±3, 5, 7σ, respectively. |
| In the text | |
Current usage metrics show cumulative count of Article Views (full-text article views including HTML views, PDF and ePub downloads, according to the available data) and Abstracts Views on Vision4Press platform.
Data correspond to usage on the plateform after 2015. The current usage metrics is available 48-96 hours after online publication and is updated daily on week days.
Initial download of the metrics may take a while.