Fig. 4
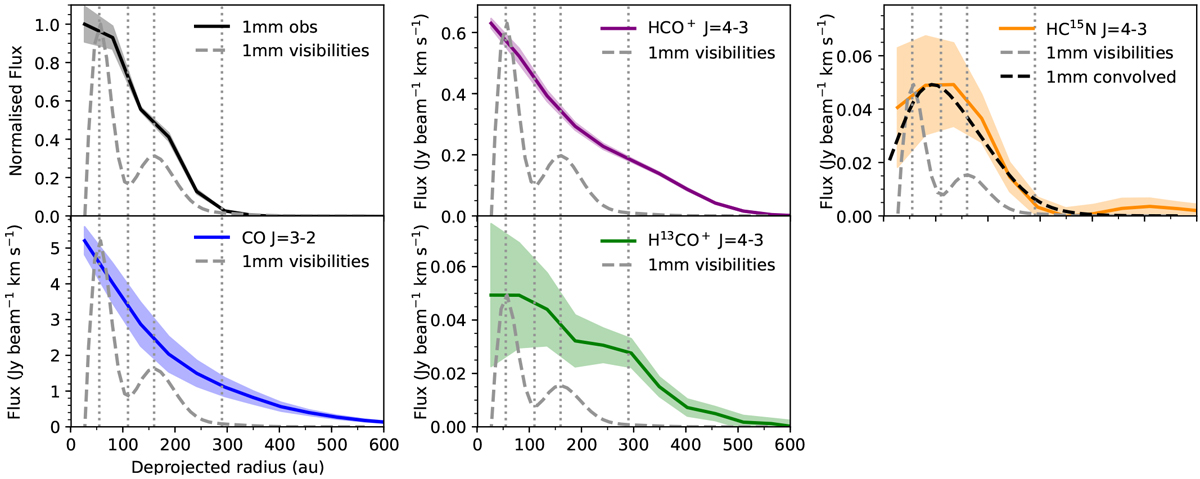
Deprojected and azimuthally-averaged radial profiles of the continuum emission, and CO, HCO+, H13CO+, HC15N line emission ratio (from top to bottom, then left to right). The coloured shaded region on each profile represents the errors (see text for details). The vertical dashed grey lines highlight the rings and gaps in the mm-dust continuum profile and the dashed grey profile is the best-fit model of the continuum uv data from (Walsh et al. 2016) and is normalised to the peak value in each plot. The dotted black line on the HC15N plot is the continuum model convolved with a 50 au beam from Walsh et al. (2016) and is normalised to the peak value in each plot.
Current usage metrics show cumulative count of Article Views (full-text article views including HTML views, PDF and ePub downloads, according to the available data) and Abstracts Views on Vision4Press platform.
Data correspond to usage on the plateform after 2015. The current usage metrics is available 48-96 hours after online publication and is updated daily on week days.
Initial download of the metrics may take a while.