Free Access
Fig. 8
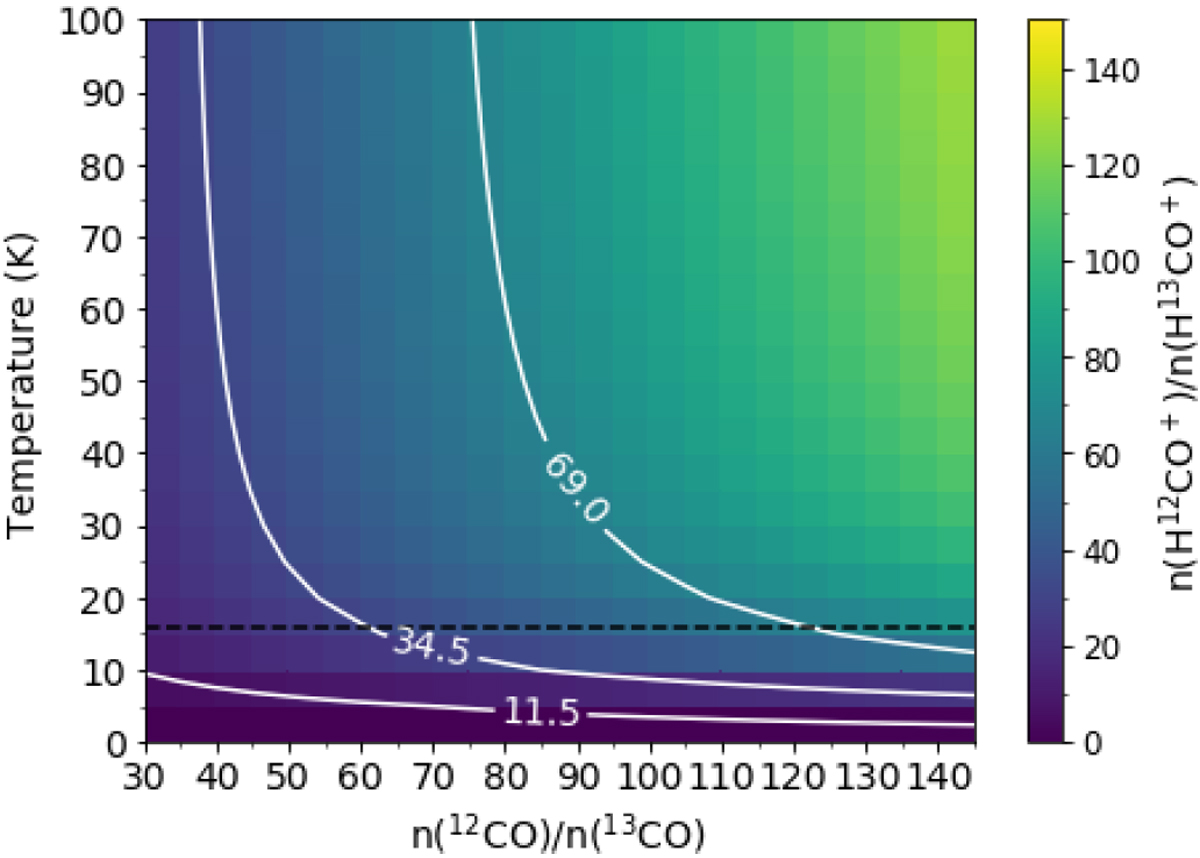
n(H12CO+)∕n(H13CO+) ratio as a function of gas temperature and underling ![]() ratio. The white contours mark the three n(H12CO+)∕n(H13CO+) ratios used in Models 1 to 3, 4 and 5, respectively. The dashed black line marks the lowest gas temperature in the disk model.
ratio. The white contours mark the three n(H12CO+)∕n(H13CO+) ratios used in Models 1 to 3, 4 and 5, respectively. The dashed black line marks the lowest gas temperature in the disk model.
Current usage metrics show cumulative count of Article Views (full-text article views including HTML views, PDF and ePub downloads, according to the available data) and Abstracts Views on Vision4Press platform.
Data correspond to usage on the plateform after 2015. The current usage metrics is available 48-96 hours after online publication and is updated daily on week days.
Initial download of the metrics may take a while.