Fig. 2
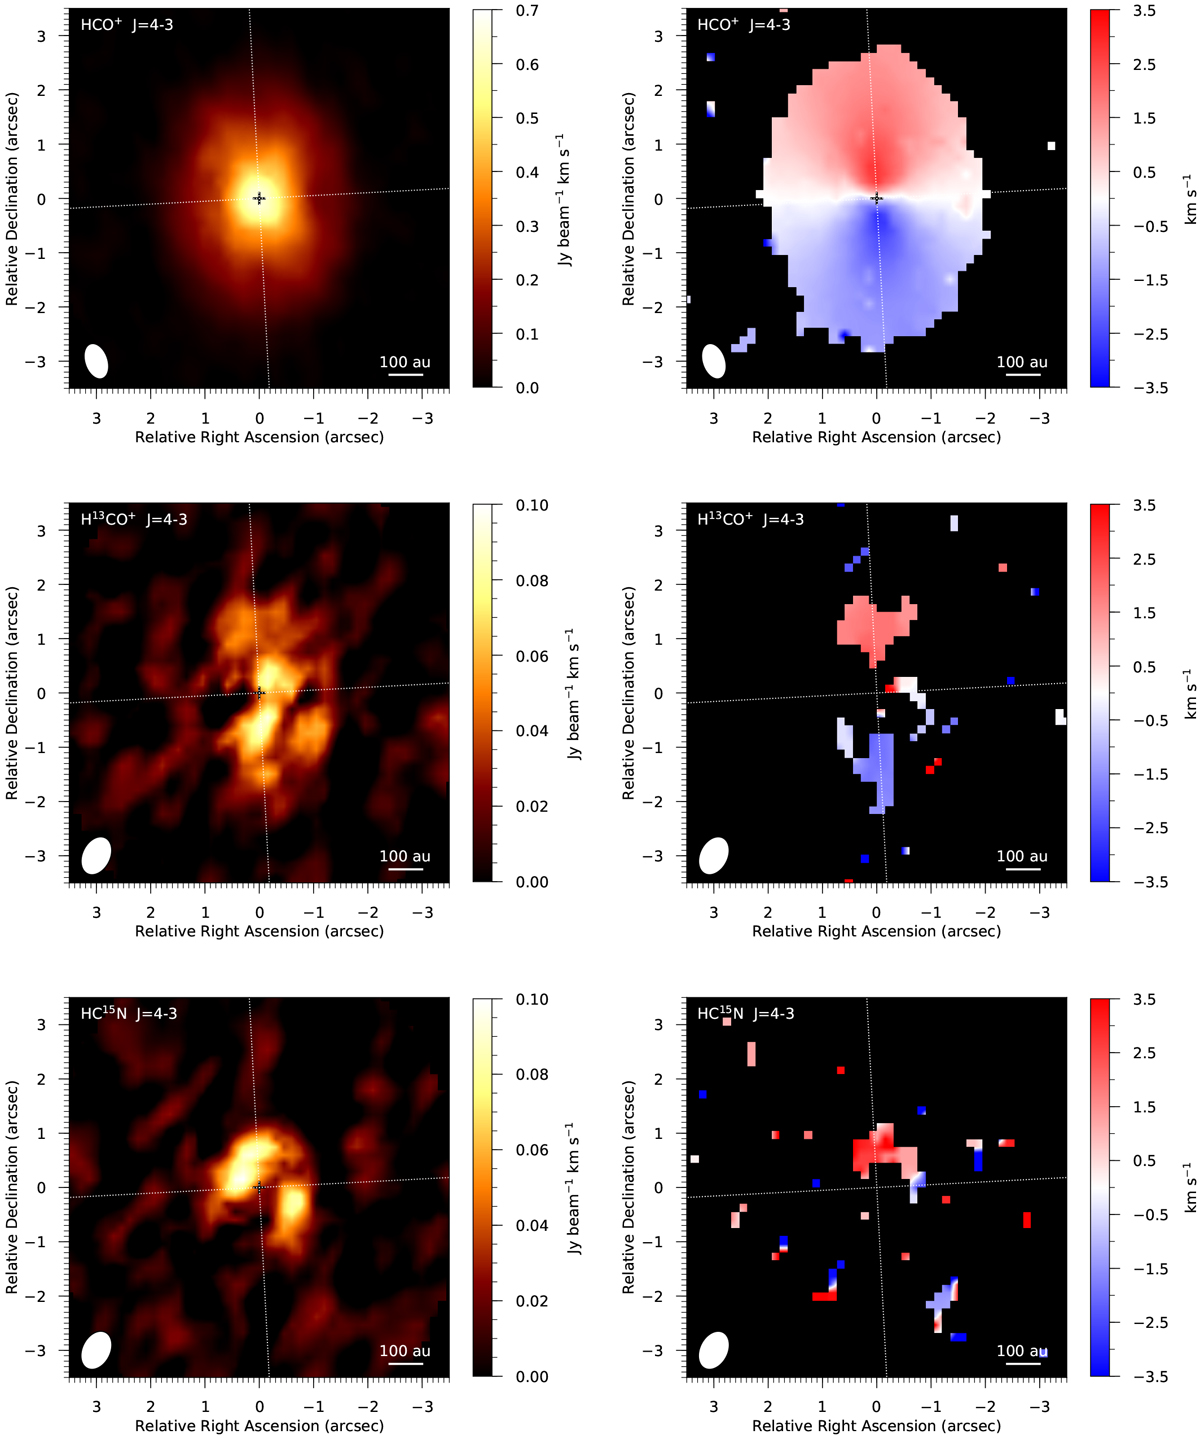
Integrated intensity maps (left) and intensity-weighted velocity (right) for the HCO+ J = 4− 3 (top), H13CO+ J = 4− 3 (middle) and HC15N J = 4− 3 (bottom) transitions generated using the Keplerian masks shown in Figs. 1 and A.1. The S/N of the integrated intensity maps are 20, 3 and 3, respectively. The intensity-weighted velocity maps were made using a 3σ clip in the channel maps. The dotted white lines mark the major and minor axes of the disk.
Current usage metrics show cumulative count of Article Views (full-text article views including HTML views, PDF and ePub downloads, according to the available data) and Abstracts Views on Vision4Press platform.
Data correspond to usage on the plateform after 2015. The current usage metrics is available 48-96 hours after online publication and is updated daily on week days.
Initial download of the metrics may take a while.