Fig. 6.
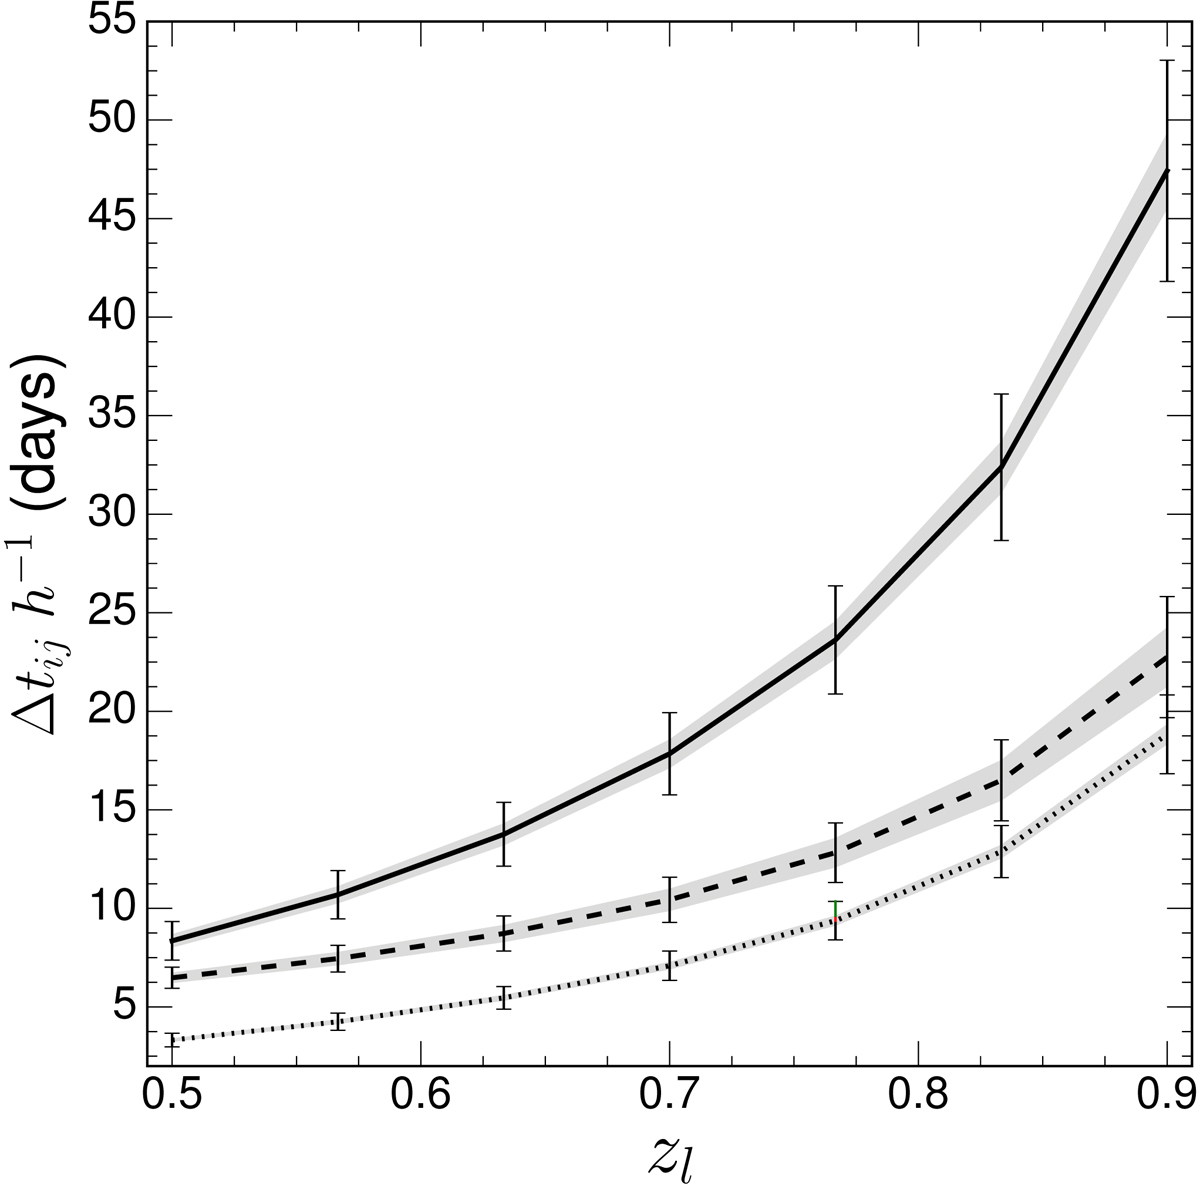
Model-predicted time delays scaled with h. The error bars combine the three sources of uncertainties described in the text. The gray shaded regions depict the contribution of the SPT to the error budget. The solid line corresponds to images C−D, the dashed line to C−A, and the dotted line to C−B. For the sake of clarity, we shifted upwards the time delays between images C−A (dashed line) by a three-day offset.
Current usage metrics show cumulative count of Article Views (full-text article views including HTML views, PDF and ePub downloads, according to the available data) and Abstracts Views on Vision4Press platform.
Data correspond to usage on the plateform after 2015. The current usage metrics is available 48-96 hours after online publication and is updated daily on week days.
Initial download of the metrics may take a while.