Fig. 5.
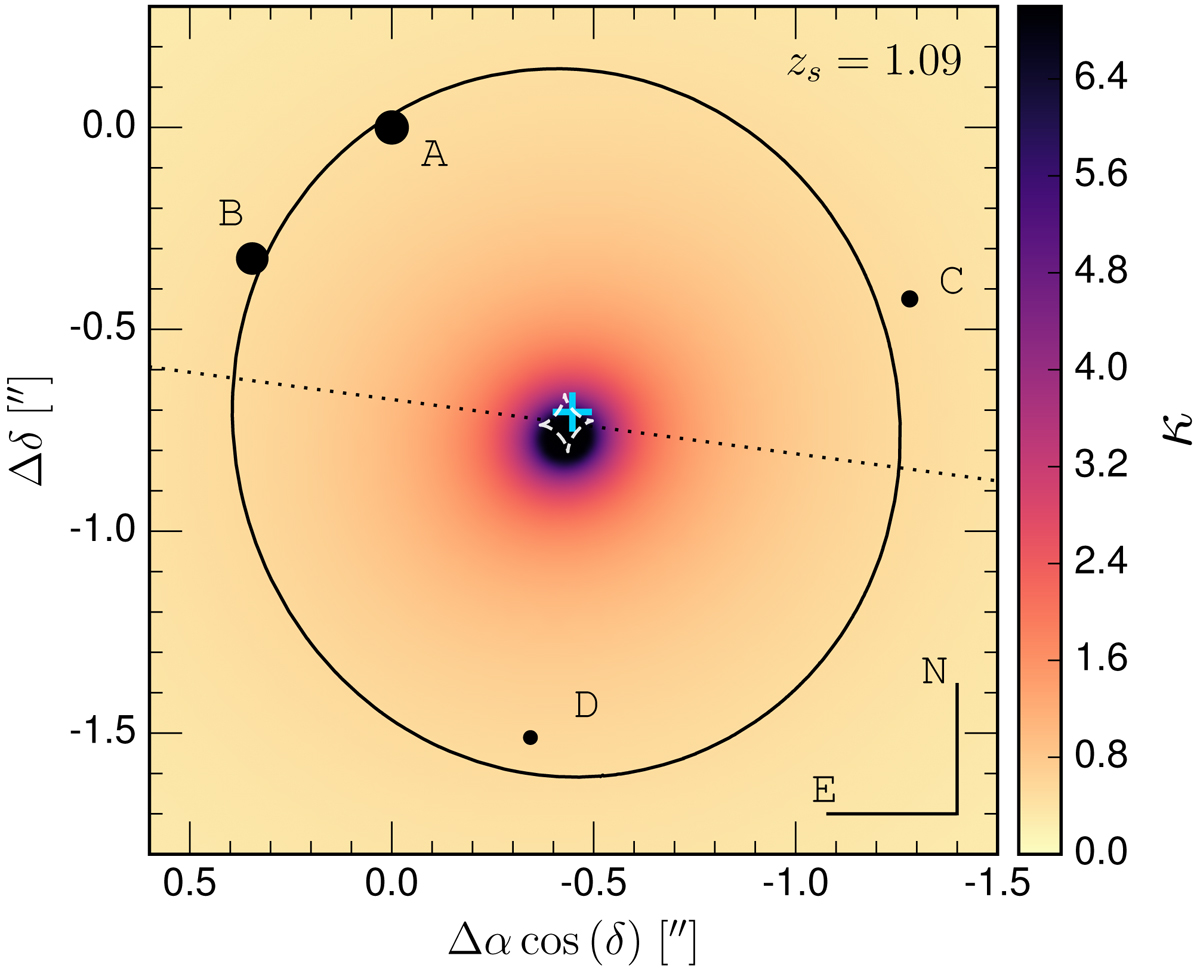
GRAL 113100−441959 image configuration. The black dots locate the image positions, and their size mimics the associated flux, as reported in the Gaia DR2. The solid line represents the tangential critical line, the diamond-shaped dashed line represents the corresponding caustic line, and the dotted line defines the direction of the external shear. Finally, the color map shows how the surface mass density κ is distributed.
Current usage metrics show cumulative count of Article Views (full-text article views including HTML views, PDF and ePub downloads, according to the available data) and Abstracts Views on Vision4Press platform.
Data correspond to usage on the plateform after 2015. The current usage metrics is available 48-96 hours after online publication and is updated daily on week days.
Initial download of the metrics may take a while.