Fig. 3.
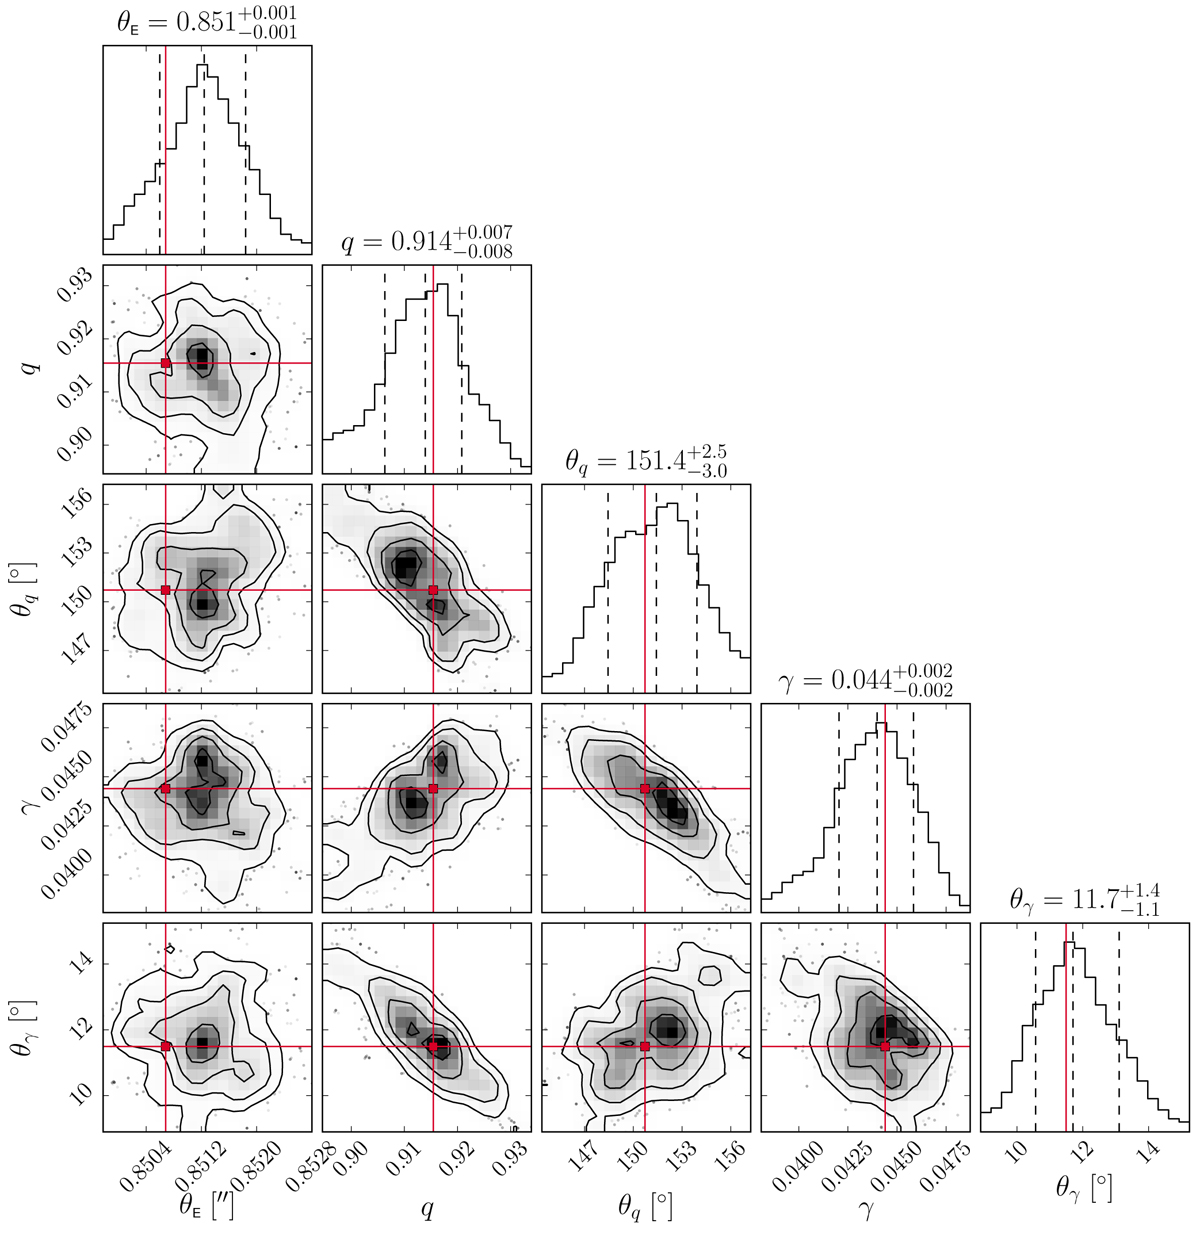
Results of MCMC sampling for the SIEg model parameters. The diagonal panels illustrate the posterior pdfs while the off-axis ones illustrate the correlation between the parameters. The vertical red lines and red crosses correspond to the best solution obtained from the down-hill simplex algorithm and used to initiate the 250 walkers. The vertical dashed lines locate the 16th and 84th percentiles.
Current usage metrics show cumulative count of Article Views (full-text article views including HTML views, PDF and ePub downloads, according to the available data) and Abstracts Views on Vision4Press platform.
Data correspond to usage on the plateform after 2015. The current usage metrics is available 48-96 hours after online publication and is updated daily on week days.
Initial download of the metrics may take a while.