| Issue |
A&A
Volume 627, July 2019
|
|
|---|---|---|
| Article Number | A80 | |
| Number of page(s) | 12 | |
| Section | Interstellar and circumstellar matter | |
| DOI | https://doi.org/10.1051/0004-6361/201834948 | |
| Published online | 04 July 2019 | |
Deuterated methanol toward NGC 7538-IRS1★
1
Université Grenoble Alpes, CNRS, IPAG,
38000
Grenoble, France
e-mail: This email address is being protected from spambots. You need JavaScript enabled to view it.
2
INAF – Osservatorio Astrofisico di Arcetri,
Largo E. Fermi 5,
50125
Florence, Italy
3
Department of Physics and Astronomy, Western Washington University,
516 High St,
Bellingham,
WA 98225, USA
4
Centre for Laser, Atomic, and Molecular Sciences (CLAMS), Department of Physics, University of New Brunswick,
PO Box 5050,
Saint John,
NB, Canada
5
Department of Astronomy, University of Michigan, 1085 South University Avenue, Ann Arbor,
Michigan
48109, USA
Received:
21
December
2018
Accepted:
15
May
2019
Abstract
We investigate the deuteration of methanol towards the high-mass star-forming region NGC 7538-IRS1. We carried out a multi-transition study of CH3OH, 13CH3OH, and the deuterated flavors, CH2DOH and CH3OD, between 1.0 and 1.4 mm with the IRAM-30 m antenna. In total, 34 13CH3OH, 13 CH2DOH lines and 20 CH3OD lines spanning a wide range of upper-state energies (Eup) were detected. From the detected transitions, we estimate that the measured D/H does not exceed 1%, with a measured CH2DOH/CH3OH and CH3OD/CH3OH of about (32 ± 8) × 10−4 and (10 ± 4) × 10−4, respectively. This finding is consistent with the hypothesis of a short-timescale formation during the pre-stellar phase. We find a relative abundance CH2DOH/CH3OD ratio of 3.2 ± 1.5. This result is consistent with a statistical deuteration. We cannot exclude H/D exchanges between water and methanol if water deuteration is of the order 0.1%, as suggested by recent Herschel observations.
Key words: ISM: molecules / ISM: abundances / radio lines: ISM / astrochemistry / ISM: individual objects: NGC 7538
This paper is dedicated to the memory of our dear colleague, Dr. Li-Hong Xu, who recently passed away.
© ESO 2019
1 Introduction
Observational studies of deuterated molecules are powerful ways to probe the chemical and physical evolution of star-forming regions. Indeed, many of the organic species that are abundant constituents of molecular clouds are synthesized in the cold prestellar phase (see Caselli & Ceccarelli 2012, for a review). At low temperatures, the difference in zero-point energy between deuterated molecules and their hydrogenated counterparts (about 1000 K for methanol and its singly deuterated flavors, Nandi et al. 2019) makes it possible for deuterated species to be formed with significantly higher relative abundances than the elemental D/H ratio (~10−5, see e.g., Ceccarelli et al. 2007, 2014; Caselli & Ceccarelli 2012). These enhanced abundance ratios can be preserved as the protostar heats the gas to temperatures large enough (≥100 K) to evaporate the ice mantles. Thus, studies of molecular D/H ratios can provide strong insight into the physical history of star-forming regions along with information on the chemical routes through which the molecular content is formed. Deuterium fractionation in low-mass star-forming regions has been the subject of significant study (e.g., see Roberts et al. 2002; Parise et al. 2006; Ratajczak et al. 2011; Jørgensen et al. 2018). These sources have shown remarkably high enhancements of deuterated molecules, including even doubly and triply deuterated species (e.g., ND3, CD3OH), which in some cases occur at abundances 12–13 orders of magnitude higher than elemental abundance would suggest (Lis et al. 2002; Parise et al. 2002, 2004). Regarding high-mass star-forming regions, only a few observations of deuterated molecules have been performed so far (e.g., Jacq et al. 1993; Ratajczak et al. 2011; Peng et al. 2012; Neill et al. 2013a,b), the best studied high-mass source of deuterated molecules being the Orion KL nebula. Low levels of fractionation are typically observed, consistent with molecular formation at higher temperatures; alternatively, warm gas-phase chemistry could alter the D/H ratio in high-mass regions during the post-evaporative phase. Interestingly enough, from chemical modeling using experimental kinetic data, Faure et al. (2015a) suggested that the D/H ratio measured in Orion-KL might not be representative of the original mantles due to deuterium exchanges between water and methanol in interstellar ices during the warm-up phase. The study of the abundance ratio of the deuterated isotopologs of methanol (CH3 OD/CH2DOH) could give access to the initial deuteration of water ices before the warm-up phase sets in. Nonetheless, taking into account the limited number of observations of deuterated species in high-mass star-forming regions, the extent to which the D/H ratios observed toward Orion KL are representative of high-mass source chemistry is uncertain. Bøgelund et al. (2018) recently reported low deuteration levels of methanol towards the HMSFR NGC6334 I, with typical values in the range of 0.01–1% for both CH2 DOH and CH3 OD. Large uncertainties on the column densities of a factor of 4–10 depending on the species remain however, which prevent any robust conclusions on the CH2 DOH/CH3OD ratio and the initial ice composition. Further observations of a sample of high-mass sources are thus required for comparison between sources and for improving our understanding of the chemistry that creates organic molecules with significant deuterium fractionation (in particular, the roles of grain-surface and gas-phase reactions).
In this study, we investigate the D/H ratio for methanol (CH3 OH, CH2 DOH, and CH3 OD) towards the high-mass star-formingregion NGC 7538-IRS1 (L = 1.3 × 10⁵ L⊙, d = 2.8 kpc, M ~ 30 M⊙, see Bisschop et al. 2007; Beuther et al. 2012), which is known to harbor high abundances of organic molecules, including methanol (e.g., Bisschop et al. 2007; Wirström et al. 2011). Results are given in Sect. 3 and discussed in Sect. 4.
2 Observations and data reduction
The data were acquired with the IRAM 30 m telescope on 2013 December 5, 6, and 10 towards NGC 7538-IRS1 with a single pointing (αJ2000 = 23 , δJ2000 = +61
 0). The vLSR was −57 km s−1. The observations were taken in position-switching mode, using a reference for the OFF position at [−600′′, 0′′]. The EMIR receiver at 1 mm was used in connection with the Fourier transform spectrometer (FTS) as backend, providing a spectral resolution of 195 kHz. The spectral resolution was subsequently degraded to 780 KHz, which corresponds to about 1 km s−1, in order to improve the signal-to-noise ratio (S/N) of the data. The following frequency ranges were covered: 212.6–220.4 GHz, 228.3–236.0 GHz, 243.5–251.3 GHz, 251.5–259.3 GHz, 259.3–267.0 GHz, and 267.2–274.9 GHz. The half-power beam sizes are 10′′ and 12′′ for observations at 250 and 212 GHz, respectively.
The data were reduced using the CLASS90 package from the GILDAS software1. The spectra are reported in this study in main beam temperature units, TMB, given by 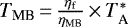 , where
  is the antenna temperature, ηf the forward efficiency (ηf = 94, 92 and 87 at 210, 230 and 274 GHz, respectively), and ηMB the main beam efficiency (ηMB = 63, 59, 49 at 210, 230 and 274 GHz, respectively2). Finally, the data presented some spurs along with standing waves, which have been removed during the data reduction. In this paper, we focus on methanol and its deuterated flavors.
The spectroscopic parameters of the targeted lines are given in Appendix A (see Tables A.1–A.4). More specifically, we used the spectroscopic data parameters3 from Xu & Hougen (1995a,b), Xu & Lovas (1997), Xu et al. (2008), and Müller et al. (2004) for CH3 OH. The parameters for CH2 DOH come from Pearson et al. (2012) and those for 13 CH3OH are from Xu & Lovas (1997), Xu et al. (1996, 2008, 2014). Regarding CH3 OD, we used the same unpublished data as Neill et al. (2013b) used for analyzing the HIFI/Herschel observations of Orion-KL. Nonetheless, the CH3OD partition functions we use in the present study (see also, Walsh et al. 2000) are given in Appendix B. Finally, collisional rates are assumed to be identical to those of CH3 OH and taken from Rabli & Flower (2010). This point is addressed in more detail in Sect. 3.3
3 Results and analysis
3.1 Detected lines
We detect several bright lines covering a wide range of upper energy levels: 34 13 CH3OH lines with Eup spanning from 23 to 397 K; 13 CH2DOH lines with Eup spanning from 25 to 94 K; and 20 CH3OD lines (10 lines for both A- and E-forms) with Eup spanning from 19 to 271 K. The observational line parameters of the clearly detected transitions are summarized in Tables A.1–A.4.
The lines profiles are well fitted by a single Gaussian profile with a little scatter on the fitted full width at half maximum (mean Δv = 3.4 ± 0.7 km s−1) and the peak intensity velocity (mean vLSR = 58.6 ± 0.6 km s−1). We note that the scatter on the peak velocity lies within 1 element of spectral resolution (1 km s−1), which makes us confident as to the line assignations. In addition, if we take into account the pointing uncertainties (typically 1′′ –2′′), the observed scatter in emission velocity peak is consistent with the large velocity gradient observed within the source by Beuther et al. (2012, and their Fig. 8). Figure 1 shows a montage of two detected transitions probing different excitation energies of 13 CH3OH, CH2 DOH, and CH3 OD (A and E) along with our local thermodynamical equilibrium (LTE) modeling. In addition, Fig. 1 also displays the spectrum of the 22,0 –31,3 transition of deuterated water which is also detected in our survey. Finally, Figs. B.1–C.2 display a montage of all the detected transitions associated with the 13 CH3OH, CH2 DOH, and CH3 OD species along with our LTE modeling.
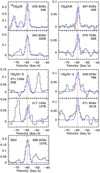 |
Fig. 1 Montage of detected transitions of methanol 13C isotopolog and deuterated forms along with that of the detected HDO line. Intensities are expressed in units of Tmb. Our LTE modeling is displayed in blue. The red dashed line marks the peak velocity of methanol transitions vLSR = − 58.9 km s−1. |
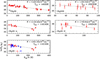 |
Fig. 2 Population diagram analysis of the 13C-methanol and the deuterated forms. A size of 3.8′′ was adopted for the emitting region. In the analysis we separate the methanol E-form from the A-form. However, as shown in the bottom left panel, their respective SLEDs are consistent with one another. Finally, please note that the y-range varies from plot to plot. |
3.2 Local thermodynamical equilibrium analysis
The physical properties (excitation temperature, column densities) of the methanol species were obtained from a population diagram analysis of their spectral line energy distributions (SLEDs). In the present study, we assume a source size of 3.8′′, corresponding to the ice evaporation region (see Bisschop et al. 2007). The derived column densities are therefore determined and given for a source size of 3.8′′. We estimatethe line opacities, under LTE conditions following Goldsmith & Langer (1999). We conclude that the 13 CH3OH, CH2DOH, and CH3OD emissions are optically thin with τ ≤ 0.03. We note that most of the transitions associated with the main methanol isotopolog are optically thick with τ(CH3OH) ≥ 1. As a consequence, we cannot determine the excitation temperature and column density of the 12 CH3OH with sufficiently accurate precision. We therefore exclude the analysis of the 12 CH3OH for the present study. The resulting physical properties are summarised in Table 1.
Figure 2 shows the population diagrams that are all well fitted by a single rotational temperature. More specifically, the population diagram analysis of 13 CH3OH yields N(13CH3OH) = (5.4 ± 0.5) × 1015 cm−2 and Trot = 140 ± 9 K. Assuming a 12 C/13C elemental abundance ratio of 70 for the local ISM (Wilson 1999), we determine the methanol column density N(CH3OH) = (3.8 ± 0.4) × 1017 cm−2. Regarding CH2DOH, we estimate a rotational temperature similar to that of 13 C methanol, Trot = 153 ± 75 K, and a column density N(CH2DOH) of (1.2 ± 0.3) × 1015 cm−2. For CH3OD we derive a lower rotational temperature of Trot = 103 ± 54 K (112 ± 18 K) for both the E- and A-forms. Nonetheless, within the error bars, the derived rotational temperatures for the deuterated methanol flavors are in agreement with that of the13C isotopolog. The derived column densities of both E- and CH3OD-A are comparable with N(CH3OD-E) = (1.7 ± 0.6) × 1014 cm−2 and N(CH3OD-A) = (2.1 ± 0.4) × 1014 cm−2, which results in a total CH3OD column density, N(CH3OD), of (3.8 ± 1.0) × 1014 cm−2. We note that the computed total CH3OD column density is commensurate within the error bars to that found if we treat both substates (E- and A-) simultaneously (see Fig. 2).
Physical properties of methanol isotopologs: rotational temperature and column density.
3.3 Nonlocal thermodynamic equilibrium analysis
The presentsection aims to verify whether the apparent LTE distribution of the CH3OD targeted transitions is consistent with nonLTE conditions along with the derived densities and temperatures.
For this purpose we combined the (unpublished) spectroscopic data of CH3OD (energy levels and radiative rates) with the collisional rate coefficients computed by Rabli & Flower (2010) for the rotational excitation of CH3OH by H2. We assumed that the -OH H/D substitution has a negligible impact on the scattering dynamics (the change in reduced mass is only 0.2%). The coupled statistical equilibrium–radiative transfer equations were then solved using the RADEX code (van der Tak et al. 2007).
Assuming a source size of 3.8′′ and a line width of4 km s−1, we ran a grid of models for the following gas densities n = 107, 108, and 109 cm−3 with the kinetic temperature varying from 20 to 200 K and the CH3OD column density lying between 1 × 10¹⁰ and 1 × 1019 cm−2. We then compared the observed and modeled LGV CH3OD-A and CH3OD-E integrated fluxes by the mean of the χ2. The computed results and minimized χ2 distributions are shown in Fig. 3.
There is no common solution for both E- and A-species with a density of 107 cm−3. A common region of minimum χ2 in the parameter space (N,T) is found for a density in the range 108 –109 cm−3. The latter is commensurate with the one derived by Beuther et al. (2012) from PdBI observations as well as that derived by Bisschop et al. (2007) from James Clerk Maxwell Telescope (JCMT) observations. Our best fits are obtained for a CH3OD column density of about ≃ 3 × 1014 cm−2 and a temperature of 100–150 K, both consistent with our LTE analysis.
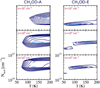 |
Fig. 3 CH3OD-A (left column) and CH3OD-E (right column) χ2 distributionsas computed with RADEX for n = 107, 108 and 109 cm−3. The minimum χ2 is displayed in cyan. |
4 Discussion
4.1 D/H in methanol
As can be seen in Table 2, the fractionation degree of singly deuterated methanol is low in NGC 7538-IRS1, with relative abundance values of 0.1% (taking into account the statistical ratio for the -CH3 functional group). Such values are similar to those reported towards other HMSRs like Orion KL. Thanks to the numerous detected lines for both CH2DOH and CH3OD, the relative abundance between the two deuterated flavors is determined with good accuracy, and is found to be equal to 3.2 ± 1.5.
Deuteration ratios measured towards NGC 7538-IRS1.
4.2 Water and HDO
Water does not exhibit the same level of fractionation as methanol in low-mass star-forming regions, with a HDO/H2O lying in the range 0.01–0.07 (Liu et al. 2011; Parise et al. 2005, 2006; Ratajczak et al. 2011; Coutens et al. 2012; Faure et al. 2015a). However, in Orion-KL water and methanol seem to be fractionated to a similar extent (Neill et al. 2013b). This is likely the result of recent desorption from ice mantles (see further details on thermal H/D exchanges between water and methanol during the warm-up phase in Faure et al. 2015a).
Although only the HDO (22,0–31,3) transition isdetected in our data, as shown in Fig. 1, we can roughly estimate the D/H ratio for water combining our result with that of different studies. Indeed, combining the observed HDO integrated flux (~0.8 ± 0.1 K km s−1) with the ones measured by Jacq et al. (1990) for the (31,2–22,1) and (21,1–21,2) transitions and assuming a source size of 3.8′′, we derived a HDO column density of about 1.6 × 1015 cm−2 and a rotational temperature of ~130 K.
From recent Herschel/HIFI observations of water in NGC 7538-IRS1, Herpin et al. (2017) derived a water abundance,  , of 8 × 10⁻⁶. Assuming a n
 of about 108 cm−3 (see Sect. 3.3), we estimate a HDO/H2O ratio lying in the range 10−4–10−3 according to the source size taken into account (see also van der Tak et al. 2006).
Incidentally, we note that Herpin et al. (2017) also derived a H2 O abundance of 5 × 10⁻⁵ for the very inner part of the hot core, as probed by a THz line observed with SOFIA.
These findings show that the water emission source size provides strong constraints on the deuteration ratio. Therefore, further interferometric observations of water and its isotopologs are clearly needed to investigate water fractionation in this source in more detail.
4.3 Comparison with other sources
Figure 4 reports the relative CH2DOH/CH3OD abundance ratio measured towards a large sample of star-forming regions, from low- to high-mass, ordered from left to right by increasing source luminosity. It is immediately apparent that there is a variation between the sources of two orders of magnitude. More specifically, in low-mass star-forming regions, methanol deuteration strongly favors the methyl group (CH2DOH) by far more than the statistical factor (3), whereas in high-mass the opposite trend is observed.
4.4 Modeling
The value of the abundance ratio CH2DOH/CH3OD toward NGC 7538-IRS1 is 3.2 ± 1.5, in good agreement with the value of three predicted by grain chemistry models (e.g., Charnley et al. 1997; Osamura et al. 2004). In these models, the deuterium fractionation of methanol proceeds in the ice during the early cold prestellar phase through the statistical addition of H and D atoms to CO molecules and the ratio s-CH2DOH/s-CH3OD is equal to the statistical value of three. More recent and sophisticated models also predict a ratio close to three (e.g., Bøgelund et al. 2018). These models however neglect processes occurring in the subsequent warm-up phase. In particular, Faure et al. (2015a) have shown that the s-CH2DOH/s-CH3OD ratio can change during this phase as a result of H/D exchanges between the hydroxyl (-OH) functional groups of methanol and water (see details in Faure et al. 2015b). This scenario was successful in explaining both the high value (>3) of the CH2DOH/CH3OD abundance ratio towards the low-mass protostar IRAS 16293-2422 and the low-value (<3) measured towards Orion (see Fig. 4).
We adapted the model of Faure et al. (2015a) to the conditions of NGC 7538-IRS1. First, the density was taken as nH = 2 × 108 cm−3 and the (equal) gas and dust temperatures as T = 100 K. The methanol abundance (by number) relative to water is 4% (Öberg et al. 2011; Boogert et al. 2015) and the mean water abundance is 5 × 10⁻⁵nH. The accreting D/H ratio is inferred from the observed CH2DOH/CH3OH ratio (see Table 2) as αm = 1.1 × 10⁻³, assuming that the initial (statistical) deuteration of CH2DOH in the ice is conserved during the hot core phase. The post-evaporative gas-phase chemistry is also entirely neglected (full details can be found in Faure et al. 2015a). The results of the model are plotted in Fig. 5: it is found that the observed CH2DOH/CH3OD ratio of 3.2 ± 1.5 can be reproduced for a solid s-HDO/s-H2O ratio in the range ~8 × 10⁻⁴−2 × 10⁻³. Therefore, while the CH2DOH/CH3OD ratio of 3.2 ± 1.5 is consistent with a statistical deuteration, the occurrence of H/D exchanges cannot be excluded. In particular, it should be noted that H/D exchanges can explain the range of values depicted in Fig. 4, that is CH2DOH/CH3OD ratios in the range ~0.1−10. To our knowledge, this is currently the only mechanism able to explain the nonstatistical deuteration of methanol in both low- and high-mass protostars.
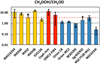 |
Fig. 4 CH2DOH/CH3OD ratios observed towards low- (yellow), intermediate- (red), and high-mass (blue) star-forming regions: IRAS 16293-2422 (Parise et al. 2002; Jørgensen et al. 2018), IRAS 4A, IRAS 2, IRAS 4B (Parise et al. 2006), SVS13A (Bianchi et al. 2017), CepE-mm (Ratajczak et al. 2011), OMC2-FIR4 (Ratajczak et al. 2011), Orion CR (Neill et al. 2013b), Orion Irc2, W3(H2O), SgrB2(N2) (Belloche et al. 2016), NGC 7538-IRS1 (this work; blue and white stripes), and NGC 6334I (Bøgelund et al. 2018). We note that values derived by Parise et al. (2006) and Ratajczak et al. (2011) were divided by a factor of 2 and 1.5, respectively, due to a spectroscopic issue (see Belloche et al. 2016). The dashed red line shows the statistical factor CH2 DOH/CH3OD = 3. |
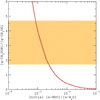 |
Fig. 5 Gas-phase abundance ratio of the deuterated isotopologs, CH2DOH/CH3OD, as function of the initial (cold) water ice deuteration. The dotted line corresponds to the analytic solution CH2 DOH/CH3OD = 0.004/(HDO/H2O), see Faure et al. (2015a) for details.The ratio observed toward NGC 7538-IRS1 is represented by the orange hatched zone. |
5 Conclusions
To summarize, we investigated the deuteration of methanol in the high-mass star-forming regions NGC 7538-IRS1 using IRAM-30m observations. Our study shows that the fractionation degree of deuterated methanol is low in this source. From the numerous (≥10) detected lines, we estimate a CH2DOH/CH3OD relative abundance ratio of 3.2 ± 1.5. Although our findings are commensurate with statistical deuteration at the icy surface of grain mantles, we cannot exclude H/D exchanges between water and methanol at the present time. Further observations of water and HDO are required to address this point.
Acknowledgements
We thank the anonymous referee for his very fruitful comments that have strengthened our paper. This work is supported by the French National Research Agency in the framework of the Investissements d’Avenir program (ANR-15-IDEX-02), through the funding of the “Origin of Life” project of the Université Grenoble-Alpes. C.F. and D.F. acknowledgesupport from the Italian Ministry of Education, Universities and Research, project SIR (RBSI14ZRHR). L.H.X. acknowledges financial support from the Natural Sciences and Engineering Research Council of Canada. We also acknowledge funding from the European Research Council (ERC) under the European Union’s Horizon 2020 research and innovation programme, for the Project “The Dawn of Organic Chemistry” (DOC), grant agreement No 741002. This project was carried out under project number 128–12 with the IRAM 30 m telescope. IRAM is supported by INSU/CNRS (France), MPG (Germany), and IGN (Spain).
Appendix A Spectroscopic and observational line parameters
Tables A.1–A.4 list the spectroscopic and observational line parameters for the observed
CH3OH-A, CH3OH-E, 13 CH3OH, CH2DOH, CH3OD-A and CH3OD-E transitions.
Methanol.
Methanol.
13C methanol.
Deuterated methanol.
Appendix B Partitionfunction of CH3OD
Table B.1 gives the respective CH3OD-A and CH3OD-E rotation partition functions we use in the present study.
Rotational partition function for CH3OD.
Appendix C IRAM-30m observations overlaid with our LTE modeling for 13 CH3OH, CH3OD-A and CH3OD-E
Figures C.1–C.3 show a montage of the detected 13CH3OH, CH2DOH, CH3OD-A and CH3OD-E transitions (see Tables A.3 and A.4 for the observational line parameters) along with our LTE modeling.
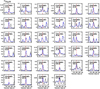 |
Fig. C.1 Montage of detected transitions associated with the methanol 13C isotopolog towards NGC 7538-IRS1. Our LTE modeling is displayed in blue. Intensities are expressed in units of Tmb. The red dashed line marks the ambient cloud velocity vLSR = −58.9 km s−1. |
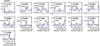 |
Fig. C.2 Montage of detected transitions associated with the deuterated CH2DOH methanol towards NGC 7538-IRS1. Our LTE modeling is displayed in blue. Intensities are expressed in units of Tmb. The red dashed line marks the ambient cloud velocity vLSR = −58.9 km s−1. |
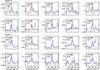 |
Fig. C.3 Montage of detected transitions associated with the CH3OD, -A and -E forms towards NGC 7538-IRS1. Our LTE modeling is displayed in blue. Intensities are expressed in units of Tmb. The red dashed line marks the ambient cloud velocity vLSR = −58.9 km s−1. |
References
- Belloche, A., Müller, H. S. P., Garrod, R. T., & Menten, K. M. 2016, A&A, 587, A91 [NASA ADS] [CrossRef] [EDP Sciences] [Google Scholar]
- Beuther, H., Linz, H., & Henning, T. 2012, A&A, 543, A88 [NASA ADS] [CrossRef] [EDP Sciences] [Google Scholar]
- Bianchi, E., Codella, C., Ceccarelli, C., et al. 2017, MNRAS, 467, 3011 [NASA ADS] [CrossRef] [Google Scholar]
- Bisschop, S. E., Jørgensen, J. K., van Dishoeck, E. F., & de Wachter, E. B. M. 2007, A&A, 465, 913 [NASA ADS] [CrossRef] [EDP Sciences] [Google Scholar]
- Bøgelund, E. G., McGuire, B. A., Ligterink, N. F. W., et al. 2018, A&A, 615, A88 [NASA ADS] [CrossRef] [EDP Sciences] [Google Scholar]
- Boogert, A. C. A., Gerakines, P. A., & Whittet, D. C. B. 2015, ARA&A, 53, 541 [Google Scholar]
- Caselli, P., & Ceccarelli, C. 2012, A&ARv, 20, 56 [NASA ADS] [CrossRef] [MathSciNet] [Google Scholar]
- Ceccarelli, C., Caselli, P., Herbst, E., Tielens, A. G. G. M., & Caux, E. 2007, Protostars and Planets V (Tucson: University of Arizona Press), 47 [Google Scholar]
- Ceccarelli, C., Caselli, P., Bockelée-Morvan, D., et al. 2014, Protostars and Planets VI (Tucson: University of Arizona Press), 859 [Google Scholar]
- Charnley, S. B., Tielens, A. G. G. M., & Rodgers, S. D. 1997, ApJ, 482, L203 [NASA ADS] [CrossRef] [Google Scholar]
- Coutens, A., Vastel, C., Caux, E., et al. 2012, A&A, 539, A132 [NASA ADS] [CrossRef] [EDP Sciences] [Google Scholar]
- Faure, A., Faure, M., Theulé, P., Quirico, E., & Schmitt, B. 2015a, A&A, 584, A98 [NASA ADS] [CrossRef] [EDP Sciences] [Google Scholar]
- Faure, M., Quirico, E., Faure, A., et al. 2015b, Icarus, 261, 14 [NASA ADS] [CrossRef] [Google Scholar]
- Goldsmith, P. F., & Langer, W. D. 1999, ApJ, 517, 209 [NASA ADS] [CrossRef] [Google Scholar]
- Herpin, F., Baudry, A., Richards, A. M. S., et al. 2017, A&A, 606, A52 [NASA ADS] [CrossRef] [EDP Sciences] [Google Scholar]
- Jacq, T., Walmsley, C. M., Henkel, C., et al. 1990, A&A, 228, 447 [NASA ADS] [Google Scholar]
- Jacq, T., Walmsley, C. M., Mauersberger, R., et al. 1993, A&A, 271, 276 [NASA ADS] [Google Scholar]
- Jørgensen, J. K., Müller, H. S. P., Calcutt, H., et al. 2018, A&A, 620, A17 [NASA ADS] [CrossRef] [EDP Sciences] [Google Scholar]
- Lis, D. C., Roueff, E., Gerin, M., et al. 2002, ApJ, 571, L55 [NASA ADS] [CrossRef] [Google Scholar]
- Liu, F.-C., Parise, B., Kristensen, L., et al. 2011, A&A, 527, A19 [NASA ADS] [CrossRef] [EDP Sciences] [Google Scholar]
- Müller, H. S. P., Menten, K. M., & Mäder, H. 2004, A&A, 428, 1019 [NASA ADS] [CrossRef] [EDP Sciences] [Google Scholar]
- Müller, H. S. P., Schlöder, F., Stutzki, J., & Winnewisser, G. 2005, J. Mol. Struct., 742, 215 [NASA ADS] [CrossRef] [Google Scholar]
- Nandi, A., Qu, C., & Bowman, J. M. 2019, J. Comput. Chem., 40, 328 [CrossRef] [Google Scholar]
- Neill, J. L., Crockett, N. R., Bergin, E. A., Pearson, J. C., & Xu, L.-H. 2013a, ApJ, 777, 85 [NASA ADS] [CrossRef] [Google Scholar]
- Neill, J. L., Wang, S., Bergin, E. A., et al. 2013b, ApJ, 770, 142 [NASA ADS] [CrossRef] [Google Scholar]
- Öberg, K. I., Boogert, A. C. A., Pontoppidan, K. M., et al. 2011, ApJ, 740, 109 [NASA ADS] [CrossRef] [Google Scholar]
- Osamura, Y., Roberts, H., & Herbst, E. 2004, A&A, 421, 1101 [NASA ADS] [CrossRef] [EDP Sciences] [Google Scholar]
- Parise, B., Ceccarelli, C., Tielens, A. G. G. M., et al. 2002, A&A, 393, L49 [NASA ADS] [CrossRef] [EDP Sciences] [Google Scholar]
- Parise, B., Castets, A., Herbst, E., et al. 2004, A&A, 416, 159 [NASA ADS] [CrossRef] [EDP Sciences] [Google Scholar]
- Parise, B., Caux, E., Castets, A., et al. 2005, A&A, 431, 547 [NASA ADS] [CrossRef] [EDP Sciences] [Google Scholar]
- Parise,B., Ceccarelli, C., Tielens, A. G. G. M., et al. 2006, A&A, 453, 949 [NASA ADS] [CrossRef] [EDP Sciences] [Google Scholar]
- Pearson, J. C., Yu, S., & Drouin, B. J. 2012, J. Mol. Spectr., 280, 119 [NASA ADS] [CrossRef] [Google Scholar]
- Peng, T.-C., Despois, D., Brouillet, N., Parise, B., & Baudry, A. 2012, A&A, 543, A152 [NASA ADS] [CrossRef] [EDP Sciences] [Google Scholar]
- Pickett, H. M., Poynter, I. R. L., Cohen, E. A., et al. 1998, J. Quant. Spectr. Rad. Transf., 60, 883 [NASA ADS] [CrossRef] [Google Scholar]
- Rabli, D., & Flower, D. R. 2010, MNRAS, 406, 95 [NASA ADS] [CrossRef] [Google Scholar]
- Ratajczak, A., Taquet, V., Kahane, C., et al. 2011, A&A, 528, L13 [NASA ADS] [CrossRef] [EDP Sciences] [Google Scholar]
- Roberts, H., Fuller, G. A., Millar, T. J., Hatchell, J., & Buckle, J. V. 2002, Planet. Space Sci., 50, 1173 [NASA ADS] [CrossRef] [Google Scholar]
- van der Tak, F. F. S., Walmsley, C. M., Herpin, F., & Ceccarelli, C. 2006, A&A, 447, 1011 [NASA ADS] [CrossRef] [EDP Sciences] [Google Scholar]
- van der Tak, F. F. S., Black, J. H., Schöier, F. L., Jansen, D. J., & van Dishoeck, E. F. 2007, A&A, 468, 627 [NASA ADS] [CrossRef] [EDP Sciences] [Google Scholar]
- Walsh, M. S., Xu, L.-H., Lees, R. M., et al. 2000, J. Mol. Spectr., 204, 60 [NASA ADS] [CrossRef] [Google Scholar]
- Wilson, T. L. 1999, Rep. Prog. Phys., 62, 143 [Google Scholar]
- Wirström, E. S., Geppert, W. D., Hjalmarson, Å., et al. 2011, A&A, 533, A24 [NASA ADS] [CrossRef] [EDP Sciences] [Google Scholar]
- Xu, L. H., & Hougen, J. T. 1995a, J. Mol. Spectr., 169, 396 [NASA ADS] [CrossRef] [Google Scholar]
- Xu, L. H., & Hougen, J. T. 1995b, J. Mol. Spectr., 173, 540 [NASA ADS] [CrossRef] [Google Scholar]
- Xu, L.-H., & Lovas, F. J. 1997, J. Phys. Chem. Ref. Data, 26, 17 [NASA ADS] [CrossRef] [Google Scholar]
- Xu, L.-H., Walsh, M. S., & Lees, R. M. 1996, J. Mol. Spectr., 179, 269 [NASA ADS] [CrossRef] [Google Scholar]
- Xu, L.-H., Fisher, J., Lees, R. M., et al. 2008, J. Mol. Spectr., 251, 305 [NASA ADS] [CrossRef] [Google Scholar]
- Xu, L.-H., Lees, R. M., Hao, Y., et al. 2014, J. Mol. Spectr., 303, 1 [NASA ADS] [CrossRef] [Google Scholar]
The spectroscopic data parameters are available at the Cologne Database for Molecular Spectroscopy catalog (CDMS; Müller et al. 2005) and/or at the JPL catalog (Pickett et al. 1998).
All Tables
Physical properties of methanol isotopologs: rotational temperature and column density.
All Figures
|
Fig. 1 Montage of detected transitions of methanol 13C isotopolog and deuterated forms along with that of the detected HDO line. Intensities are expressed in units of Tmb. Our LTE modeling is displayed in blue. The red dashed line marks the peak velocity of methanol transitions vLSR = − 58.9 km s−1. |
| In the text | |
|
Fig. 2 Population diagram analysis of the 13C-methanol and the deuterated forms. A size of 3.8′′ was adopted for the emitting region. In the analysis we separate the methanol E-form from the A-form. However, as shown in the bottom left panel, their respective SLEDs are consistent with one another. Finally, please note that the y-range varies from plot to plot. |
| In the text | |
|
Fig. 3 CH3OD-A (left column) and CH3OD-E (right column) χ2 distributionsas computed with RADEX for n = 107, 108 and 109 cm−3. The minimum χ2 is displayed in cyan. |
| In the text | |
|
Fig. 4 CH2DOH/CH3OD ratios observed towards low- (yellow), intermediate- (red), and high-mass (blue) star-forming regions: IRAS 16293-2422 (Parise et al. 2002; Jørgensen et al. 2018), IRAS 4A, IRAS 2, IRAS 4B (Parise et al. 2006), SVS13A (Bianchi et al. 2017), CepE-mm (Ratajczak et al. 2011), OMC2-FIR4 (Ratajczak et al. 2011), Orion CR (Neill et al. 2013b), Orion Irc2, W3(H2O), SgrB2(N2) (Belloche et al. 2016), NGC 7538-IRS1 (this work; blue and white stripes), and NGC 6334I (Bøgelund et al. 2018). We note that values derived by Parise et al. (2006) and Ratajczak et al. (2011) were divided by a factor of 2 and 1.5, respectively, due to a spectroscopic issue (see Belloche et al. 2016). The dashed red line shows the statistical factor CH2 DOH/CH3OD = 3. |
| In the text | |
|
Fig. 5 Gas-phase abundance ratio of the deuterated isotopologs, CH2DOH/CH3OD, as function of the initial (cold) water ice deuteration. The dotted line corresponds to the analytic solution CH2 DOH/CH3OD = 0.004/(HDO/H2O), see Faure et al. (2015a) for details.The ratio observed toward NGC 7538-IRS1 is represented by the orange hatched zone. |
| In the text | |
|
Fig. C.1 Montage of detected transitions associated with the methanol 13C isotopolog towards NGC 7538-IRS1. Our LTE modeling is displayed in blue. Intensities are expressed in units of Tmb. The red dashed line marks the ambient cloud velocity vLSR = −58.9 km s−1. |
| In the text | |
|
Fig. C.2 Montage of detected transitions associated with the deuterated CH2DOH methanol towards NGC 7538-IRS1. Our LTE modeling is displayed in blue. Intensities are expressed in units of Tmb. The red dashed line marks the ambient cloud velocity vLSR = −58.9 km s−1. |
| In the text | |
|
Fig. C.3 Montage of detected transitions associated with the CH3OD, -A and -E forms towards NGC 7538-IRS1. Our LTE modeling is displayed in blue. Intensities are expressed in units of Tmb. The red dashed line marks the ambient cloud velocity vLSR = −58.9 km s−1. |
| In the text | |
Current usage metrics show cumulative count of Article Views (full-text article views including HTML views, PDF and ePub downloads, according to the available data) and Abstracts Views on Vision4Press platform.
Data correspond to usage on the plateform after 2015. The current usage metrics is available 48-96 hours after online publication and is updated daily on week days.
Initial download of the metrics may take a while.