Free Access
Fig. 1
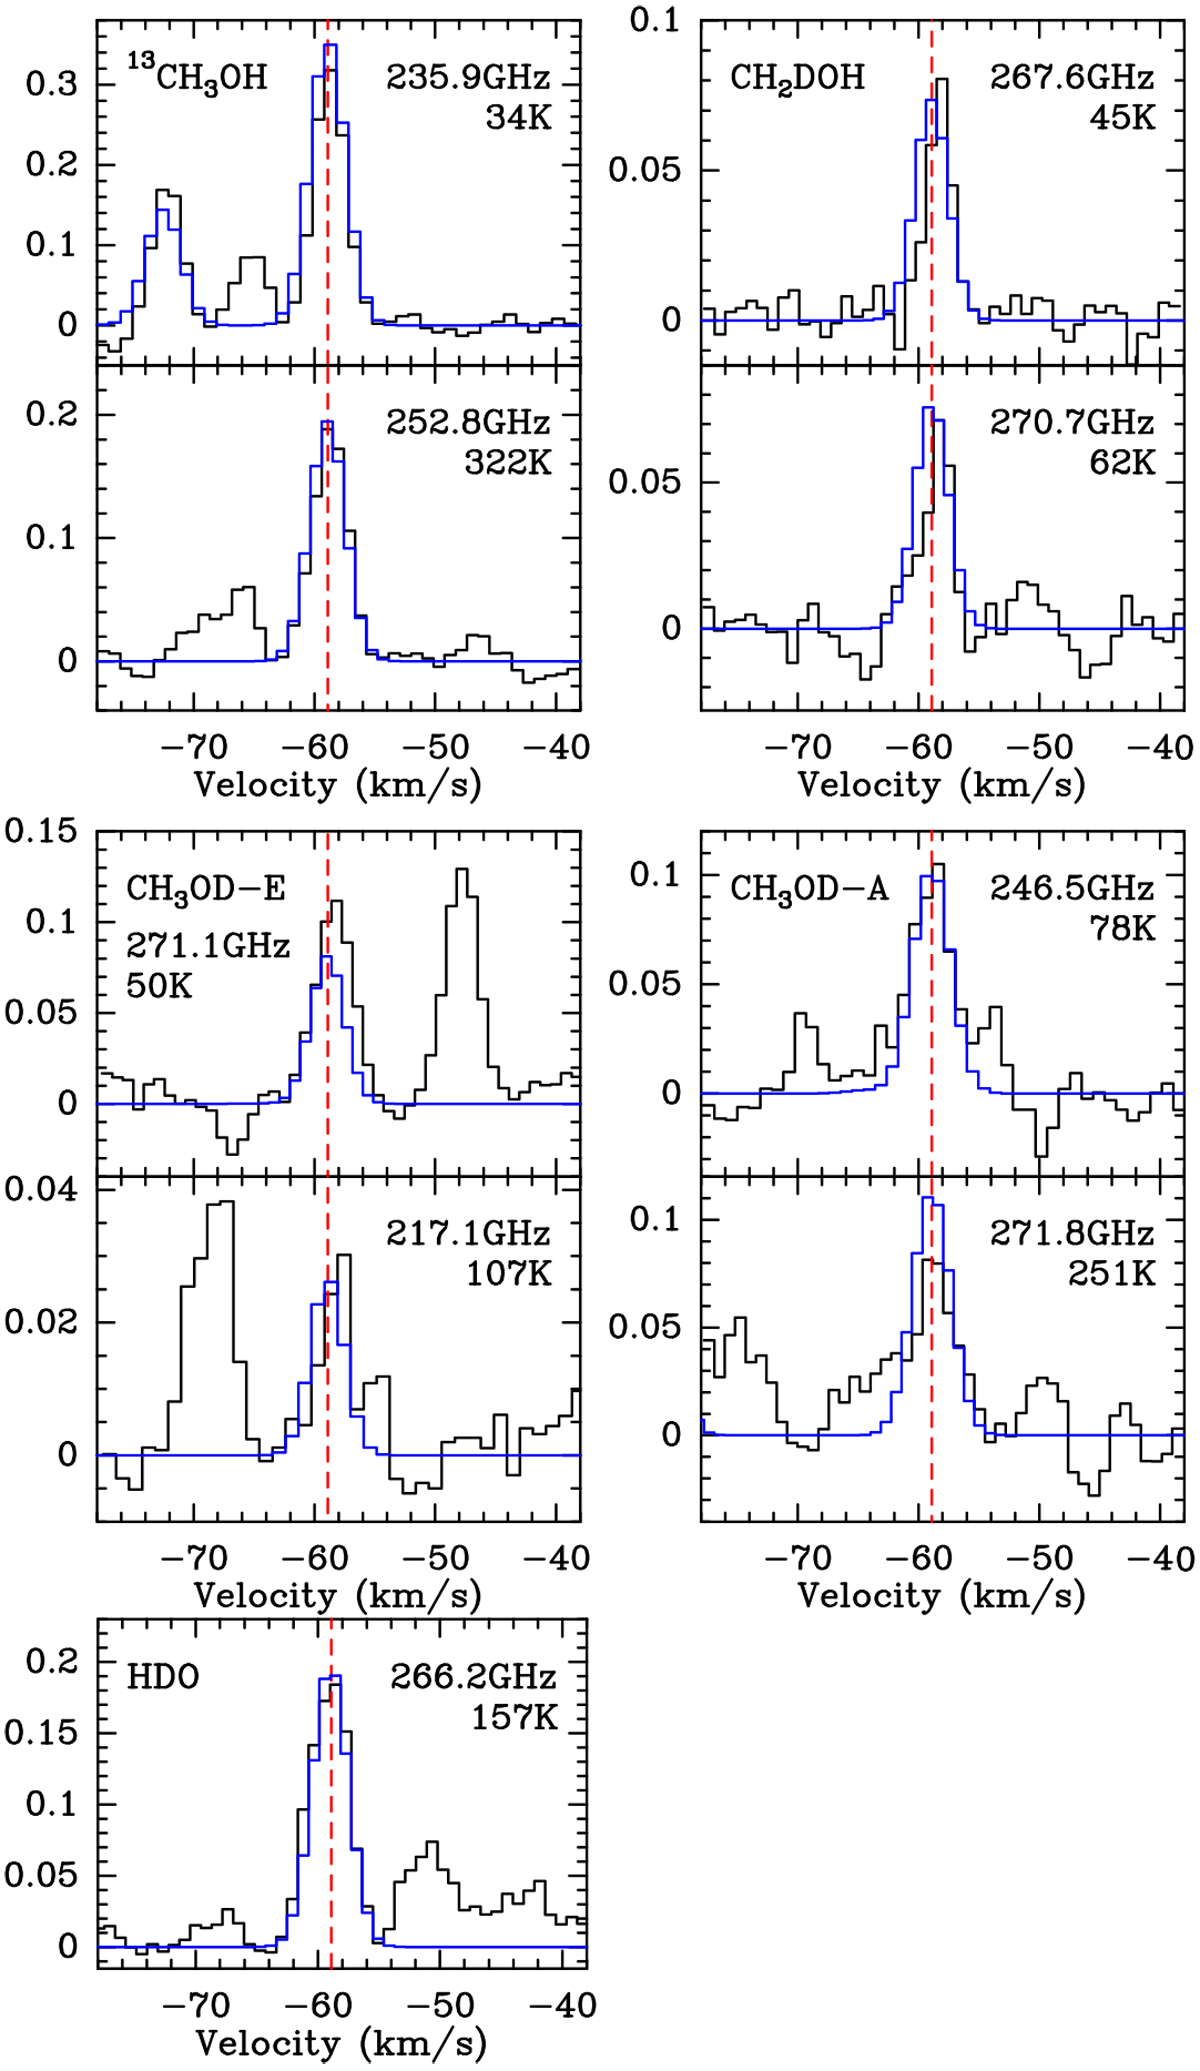
Montage of detected transitions of methanol 13C isotopolog and deuterated forms along with that of the detected HDO line. Intensities are expressed in units of Tmb. Our LTE modeling is displayed in blue. The red dashed line marks the peak velocity of methanol transitions vLSR = − 58.9 km s−1.
Current usage metrics show cumulative count of Article Views (full-text article views including HTML views, PDF and ePub downloads, according to the available data) and Abstracts Views on Vision4Press platform.
Data correspond to usage on the plateform after 2015. The current usage metrics is available 48-96 hours after online publication and is updated daily on week days.
Initial download of the metrics may take a while.