| Issue |
A&A
Volume 625, May 2019
|
|
|---|---|---|
| Article Number | A6 | |
| Number of page(s) | 7 | |
| Section | Extragalactic astronomy | |
| DOI | https://doi.org/10.1051/0004-6361/201832998 | |
| Published online | 30 April 2019 | |
X-ray absorbing column densities of a complete sample of short gamma ray bursts
1
Dipartimento di Fisica, Università degli Studi di Milano, Via Celoria 16, 20133 Milano, Italy
e-mail: This email address is being protected from spambots. You need JavaScript enabled to view it.
, This email address is being protected from spambots. You need JavaScript enabled to view it.
2
INAF-Osservatorio Astronomico di Brera, Via Bianchi 46, 23807 Merate, LC, Italy
3
Università degli Studi di Milano-Bicocca, Piazza della Scienza 3, 20126 Milano, Italy
4
Laboratoire Univers et Particules de Montpellier, Université Montpellier, CNRS/IN2P3, Montpellier, France
5
INAF-Osservatorio Astronomico di Trieste, Via G. B. Tiepolo 11, 34143 Trieste, Italy
6
INFN-Istituto Nazionale di Fisica Nucleare, Sezione di Trieste, Via Valerio 2, 34127 Trieste, Italy
7
INFN-Sezione di Milano-Bicocca, Piazza della Scienza 3, 20126 Milano, Italy
8
INAF-Istituto di Astrofisica Spaziale e Fisica Cosmica Milano, Via E. Bassini 15, 20133 Milano, Italy
9
Department of Astronomy and Astrophysics, The Pennsylvania State University, University Park, PA 16802, USA
10
GEPI, Observatoire de Paris, PSL Research University, CNRS, Place Jules Janssen, 92195 Meudon, France
Received:
10
March
2018
Accepted:
17
March
2019
Abstract
Context. X-ray absorbing column densities (NH) are used as a parameter to quantify the amount of absorbing material along the line of sight. The high values found for long gamma ray bursts (LGRBs) confirmed that these events take place in dense, star-forming environments, joining as an indirect proof the observation of supernovae associated to the bursts and the location in the brightest galaxy regions. Recently, the simultaneous detection of a short gamma ray burst (SGRB) and a gravitational wave signal occurred, strongly supporting the hypothesis that SGRBs instead originate from the merger of compact objects. The different predictions of the two progenitor scenarios for short and long GRBs should be reflected in a difference in the amount of absorbing matter between the two populations, with SGRBs occurring in less dense environments. Previous studies found that the two column density distributions were indistinguishable when compared in the same redshift range. The samples, though, were relatively small (10–12 SGRBs), and spanned a redshift range z ≲ 1.
Aims. We update a flux-limited complete sample of Swift-based SGRBs, the SBAT4, bringing it to 25 events and doubling its previous redshift range. We then evaluate the column densities of the events in the updated sample, in order to compare them with the NH distribution of LGRBs, using the sample BAT6ext.
Methods. We relied on Monte Carlo simulations of the two populations and compare the computed NH distributions with a two sample Kolmogorov–Smirnov (K–S) test. We then studied how the K–S probability varies with respect to the redshift range we consider.
Results. We find that the K–S probability keeps decreasing as redshift increases until at z ∼ 1.8 the probability that short and long GRBs come from the same parent distribution drops below 1%. This testifies for an observational difference among the two populations. This difference may be due to the presence of highly absorbed LGRBs above z ∼ 1.3, which have not been observed in the SGRB sample yet, although this may be due to our inability to detect them, or to the relatively small sample size.
Key words: gamma-ray burst: general / X-rays: general
© ESO 2019
1. Introduction
Gamma ray bursts (GRBs) are luminous explosions occurring at cosmological distances that release a huge amount of high-energy photons within a short time. The bimodal distribution of their duration and spectral hardness led to the currently-used classification of long-soft GRBs (LGRBs), lasting more than ∼2 s, and short-hard GRBs (SGRBs), which last less than ∼2 s (Kouveliotou et al. 1993).
These differences likely reflect the different origin of these events. Indeed, observational evidence allowed the association of LGRBs to core-collapse supernovae (SNe; supporting the so-called “collapsar model”, see Hjorth & Bloom 2012; Cano et al. 2017, for recent reviews), while the recent detection of a gravitational wave (GW) source with a simultaneous SGRB seems to be the long-sought “smoking gun” that sets mergers of double neutron stars (NS-NS) as the progenitors of these events (Abbott et al. 2017; Goldstein et al. 2017; Savchenko et al. 2017). According to this scenario, called the compact object binary merger, which also includes neutron star-black hole (NS-BH) binary systems (Eichler et al. 1989; Nakar 2007), the merging objects originate either from (i) a “primordial binary” (Narayan et al. 1992), whose component stars were gravitationally bound since their birth, or (ii) a “dynamical binary”, formed by means of dynamical capture and possibly exchange in dense stellar environments (e.g., globular clusters) during their relaxation (Grindlay et al. 2006; Salvaterra et al. 2008). In case (i) the system must survive the SN explosions of its components, whose natal kick may drive the binary away from the star-forming region. A “fast-merging” variation of the primordial binary channel has been proposed (Belczyński & Kalogera 2001; Perna & Belczynski 2002; Belczynski et al. 2006) and predicts the coalescence to occur in a relatively short timescale (∼107 yr), meaning that the bursts would likely occur within their formation sites, possibly in dense star-forming regions. This was motivated by the discovery of the double radio pulsar PSR J0737–3039 (Burgay et al. 2003), with a merging time of ∼85 Myr.
The merger model and its evolutionary channels predict other features, besides the concurrent GW emission, which can be observationally tested to indirectly probe the nature of SGRB progenitors. One viable way to do this is the study of the environment where SGRBs occur, in comparison to that of LGRBs. According to the collapsar model, LGRBs occur in their star-forming regions, in other words in an ambient that is quite dense of gas and dust (Galama & Wijers 2001; Watson et al. 2007; Campana et al. 2007; Schady et al. 2011; Heintz et al. 2018). For SGRBs, instead, the merger model predicts both dense environments (for systems evolving through the fast-merging channel) or less dense regions, such as the outskirts of the host galaxies (for primordial binaries with long merging time that are subject to a natal kick), or for systems that are dynamically formed (Grindlay et al. 2006; Salvaterra et al. 2008). The fact that a non-negligible fraction1 of the mergers should occur far from star forming regions, and generally at larger offsets from their host galaxies (Wang et al. 2018), should in principle produce an appreciable difference in the absorption of the optical and X-ray afterglows for the SGRB and LGRB populations. Measuring the total amount of matter needed to produce a given absorption in the afterglow can hence be a viable test to probe the “typical” environments of the two populations, and even discriminate among the different evolutionary channels of SGRBs. This piece of information is, however, hard to obtain from optical spectra because of photoionisation of the material surrounding the burst, and the amount of hydrogen along the line of sight (NHI) can only be measured for GRBs at z ≳ 2. Thus, it is more convenient to work in the X-ray band, where metals are the main absorbers and the measurement is less sensitive to photoionisation.
Such studies have been conducted on many differently-selected samples of LGRBs (Campana et al. 2010, 2012) by evaluating their intrinsic X-ray absorbing column densities (NH), and the high values of NH that were found are consistent with the collapsar model. For SGRBs, Kopač et al. (2012) and Margutti et al. (2012) independently found that their column density distribution is indistinguishable from that of LGRBs when the two are compared within the same redshift bin. These studies were based on 10–12 events which had a redshift association (which is a mandatory report to derive the intrinsic column density values) spanning up to z ∼ 1, and used them to represent their whole Neil Gehrels Swift Observatory (Swift)-based SGRB samples, which were much bigger (50–60 events) and lacked any information about z for about 75% of them.
D’Avanzo et al. (2014) tried to overcome these limitations by building a sample that was more representative of the whole SGRB population, namely the SBAT4. They first selected all of the events with a Swift/BAT detection and a prompt Swift/XRT follow-up (but no afterglow detection is required, so that no X-ray-selection bias was introduced). Then, they restricted the sample to those SGRBs with a prompt emission that had a peak photon flux P ≳ 3.5 ph s−1 cm−2, computed with Swift/BAT lightcurve bin width of 64 ms (making SBAT4 a flux-limited complete sample, we note that peak flux threshold and time during which the emission peak is computed are different for SBAT4 and BAT6). Then they required that the events were observed in favorable conditions for redshift determination (AV < 0.5 mag). This condition implies that the SBAT4 (16 events) has a high redshift completeness (69%). These criteria were the analogous2 of those used by Salvaterra et al. (2012) to select the BAT6, which is a complete sample of LGRBs (58 events with a redshift completeness of 95%) that was later updated to BAT6ext by Pescalli et al. (2016) (99 LGRBs with a redshift completeness of ∼82%).
In order to cope with low statistic and redshift incompleteness, in this paper we take a different approach. We first updated the SBAT4 peak-flux-limited sample up to April 2016, bringing it to 25 GRBs and extending its maximum redshift from z ∼ 1 to z ∼ 2.2, even though the redshift completeness is lowered to 52%. For the SGRBs of the SBAT4 with known redshift, we evaluated the intrinsic column density, while for the rest of the sample we worked out the column density in excess of the Galactic value at zero redshift (Sect. 2). The “darkness” of short GRBs of the SBAT4 sample is worked out in Sect. 3. We then made use of Monte Carlo simulations to simulate the intrinsic column density distribution of SGRBs and compare it, on a statistical basis, with the NH(z) distribution of LGRBs (Sect. 4). Discussion and calculations are outlined in Sect. 5, while conclusions are drawn in Sect. 6.
2. Column density evaluation
The total column density can be considered as the summed effect of three main absorbers: our Galaxy, the intergalactic medium (IGM), and the host galaxy of the GRB. Here we neglect the effects of the IGM (Arcodia et al. 2018), which are negligible especially given the low redshift of the SBAT4 GRBs, and, more importantly, since these effects are the same for GRBs in the SBAT4 and BAT6ext samples.
Column densities must be evaluated on X-ray spectra that are relative to time intervals where the 0.3 − 1.5/1.5 − 10 keV hardness ratio is constant, in order to avoid unphysical biases in absorption due to spectral changes. We selected time intervals from which to extract the spectra using the lightcurves of the events in SBAT4. Lightcurves and spectra were retrieved from the UK Swift Science Data Centre3 (Evans et al. 2009); the Swift/XRT lightcurve and spectra repository. Since we had to avoid the epochs of the lightcurves which presented strong spectral variability, we usually skipped the early times of the afterglow. As a consequence, we selected our data mostly in photon counting (PC) mode. There were spectra, though, that had too few photons at late times and this prevented any reliable analysis. In these cases, we also considered data from the window timing (WT) mode, early in the afterglow lightcurve. The spectra we worked with were binned with at least one photon in each spectral bin in order to use the C-statistic for fitting (Cash 1979). We used the XSPEC 12.6.1 software (Arnaud 1996), using abundances from Wilms et al. (2000) and cross-sections from Verner et al. (1996). We modeled the spectra with a combination of a power law model (POW) and two absorption components, one from our Galaxy (TBABS, frozen), whose values (taken from the UK Swift Science Data Center) are those from Willingale et al. (2013), and one at the GRB redshift (ZTBABS, which we left free to vary). For GRBs with unknown redshift, we set z = 0.
For most SGRBs we took data from PC mode and fit them with the model described above. Whenever the number of photons in the selected time slice was not high enough for the fit to return a measurement (i.e., the fit returned an upper limit at 90% confidence level), we searched for other time intervals in the late-time spectrum (PC mode) that presented a constant hardness ratio, in order to increase the statistics and allow for a better fit. We found just one suitable interval for GRB 140903A. For all of the remaining bursts whose analysis resulted in an upper limit, we then looked for an appropriate time interval in the early-time lightcurve (WT data) and found it for five SGRBs (three of which had a redshift association). Furthermore, for GRB 090515 only WT data were available.
The underlying assumption that drove the analysis of the GRBs that had two different epochs selected was the fact that, while spectra evolve in time, the quantity of absorbing matter is constant throughout the whole duration of the afterglow. The spectra of the two different epochs of GRB 140903A were simultaneously fit with different power laws but with the same column density value for both epochs.
Also, the five events that involved WT observations had their two spectra simultaneously fit, but they required a different modeling. As demonstrated by Butler & Kocevski (2007), early-time spectra cannot be fit with a simple power law, because they might rapidly change. To overcome this issue, the simultaneous fit must be carried out using a simple power law to model PC data and adding a cutoff-energy parameter (left free to vary) to the power law used to fit WT data (Campana et al. 2010). Even if the cutoff-energy, in the end, resulted outside the XRT energy band (i.e., the cutoff is unnecessary) it is important to have this additional freedom to cope with cases in which the X-ray spectrum is instead curved. GRB 090515 was fit with the cutoff power law only.
Of the 13 events with known redshift within the SBAT4, we could compute the intrinsic column density for six of them, while for seven we derived only upper limits. The distribution of the six measurements for this sample has a mean value of log(NH(z)/ cm−2) = 21.4 and σlog(NH(z)/cm−2) = 0.4 (which is the same value found by Margutti et al. 2012 and Kopač et al. 2012). Of the remaining 12 SGRBs without redshift, we could derive three measurements and nine upper limits, resulting in a total of nine measurements and 16 upper limits for the whole SBAT4. The values of the derived NH are shown in Table 1, and they are plotted against redshift in Fig. 1.
Computed column densities for the SGRBs of the SBAT4 sample.
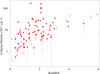 |
Fig. 1. Column density values of the SBAT4 (blue) and the values of the BAT6ext (red) from Arcodia et al. (2016). Down-pointing arrows represent upper limits for both the populations. Although the numbers of SGRBs is low, the distribution of NH of the events in SBAT4 seems to track that of BAT6ext until z ∼ 1.3, where LGRBs are slightly more absorbed, and some heavily absorbed LGRBs fill the top region of the plot. |
3. Darkness for short gamma ray bursts
Given a large number of upper limits for the absorbing column density or the lack of redshift we tried to derive indirect information on the possibility that SGRBs are absorbed by studying their darkness. Darkness has been introduced by Jakobsson et al. (2004; see also Fynbo et al. 2001) to settle on statistical grounds the lack of optical afterglow for a sizeable fraction of well localized LGBRs. Three scenarios were put forward involving either obscuration (optical emission is absorbed), high redshift (optical emission is suppressed by damped Lα absorbers), or low-density ambient medium (i.e., intrinsically faint optical emission). This last possibility occurs when the cooling frequency lies below the X-ray domain, so that the X-ray emission is independent on the circumburst medium but the optical emission depends on the ambient density n1/2 (Sari & Piran 1999). Fong et al. (2015) showed that this occurs for almost half of SGRBs in their sample. In order to assess if a GRB was not detected, a link to the overall afterglow properties is important. This can be obtained by computing the optical-to-X-ray spectral index at a given time. In the fireball model, the spectral index β (with Fν ∝ ν−β) for connecting X-ray (∼1018 Hz) and optical (∼1014 Hz) frequencies, βOX, is expected to lie in the 0.5–1.25 range, unless the optical emission is dimmer for one of the reasons described above; GRBs whose afterglows has βOX < 0.5 are defined as “dark” (Jakobsson et al. 2004, see also Van der Horst et al. 2009).
The spectral index βOX for LGRBs was evaluated at 11 h after the onset (observer frame). This is hardly feasible for SGRBs, since their emission has already gone beyond the reach of optical and X-ray facilities at that time. We evaluate βOX for our complete sample of SGRBs at 1 h. Even at such a close time to the prompt, a number of SGRBs do not show a detection. For the X-ray fluxes, we relied on Swift observation with the XRT. Data were taken from XRT web pages4 (Evans et al. 2009). Data were interpolated and in a few cases extrapolated using a fit of the entire (power law) light curve. For the optical fluxes, we relied on data found in the literature (for SGRBs up to 2014 on Fong et al. 2015); on papers and GCN circulars for the others). For optical data, we consider r band and usually we derived our values thanks to a back-extrapolation of the light curve including early time upper limits when available (the earliest point in the back extrapolated light curves are in the 2–6 h range). In one case we forward-extrapolated from 30 min. For 9 SGRBs we selected the upper limit closer in time to 1 h (from 30 min to 2 h). For 6 SGRBs we were not able even to place a meaningful upper limit on the r-band optical flux at 1 h due to the lack of any data or to the presence of late (∼12 h) upper limits. Our findings are summarized in Fig. 2, where we show the spectral parameter βOX as a function of the X-ray flux, of redshift, and of the intrinsic column density. As might have been expected, a number of short GRBs are dark (∼75%). This is different to long GRBs, where a fraction of 30% has been found as dark (Melandri et al. 2012). No clear trend with redshift or intrinsic column density is immediately apparent from our analysis (see Fig. 2), therefore suggesting that the tenuous ambient medium is the root source for faintness of the optical emission, in most of the cases. In our sample, there is just one potential heavily absorbed SGRB: GRB151229, with a column density at z = 0 of  cm−2, which will overcome the threshold of 1022 cm−2 for redshifts z ≳ 0.2 and of 1023 cm−2 for redshifts z ≳ 2.
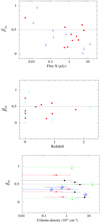 |
Fig. 2. Upper panel: βOX for the short GRBs of the SBAT4 sample. Upper limits are shown with a down-pointing arrow. The horizontal line marks the limit of GRB darkness. Medium panel: βOX as a function of redshift. GRBs with unknown redshift are shown at z = 0. Lower panel: βOX as a function of the intrinsic column density. Down-pointing arrows indicate upper limits on β. Right-pointing arrows indicate GRBs with unknown redshift for which the column density has been computed at z = 0. |
4. Simulations and comparison with BAT6ext
The lack of redshift in the sample (13/25, 52% completeness) and the even smaller number of measured column densities for bursts with associated z we got (6/25), make the distribution of NH(z) we derived, also including upper limits, not fully representative of the whole population of SGRBs. The lack of redshift, and therefore of a proper NH(z) evaluation for almost half of the SBAT4 sample, is particularly restrictive for our studies, hampering ab initio any survival analysis of the two GRB populations (long and short GRBs). We decided then to rely on Monte Carlo simulations to cope with redshift incompleteness and upper limits.
The method was as follows. For GRBs with measured NH, the simulation extracted the column density values from a Gaussian distribution that peaked on the measured value, assuming a symmetric error that is the largest of the two reported in Table 1 (a lower limit was fixed in the Gaussian to prevent the occurrence of unphysical negative values of NH). If the redshift of the GRB was unknown, we put the simulated value at zero redshift (NH(0)). If needed, a value of z was randomly assigned, based on the observed redshift distribution of the SBAT4 sample as updated in this work, that is, assuming it as valid also for the fraction of the sample without a redshift measurement. We then obtained the value NH(z) by multiplying NH(0) by the scaling factor (1 + z)2.4 (Campana et al. 2014).
To check for the effectiveness of the choice of this redshift distribution, we compared the column density distribution of short GRBs with and without redshift, evaluated setting all of the events at z = 0. We worked out a Monte Carlo simulation to provide 1000 realisations of our sample to deal with upper limits and errors. We split the simulated column densities into two subsamples depending if the redshift was available or not, and compared the two by means of a Kolmogorov–Smirnoff (K–S) test. The mean probability over the 1000 simulations is 56% (with a standard deviation of 27%). This testifies that the use of the observed redshift distribution was a reasonable assumption.
After simulating 1000 times the sample of SGRBs (with the randomly assigned redshift, if needed), the same procedure was applied to the sample of 99 LGRBs of the BAT6ext, with the same caveats on upper limits and redshifts, taking the NH values from Arcodia et al. (2016). We took the redshift distribution from Pescalli et al. (2016). This process resulted in 1000 mock samples of SGRBs and LGRBs each.
We then compared the two simulated populations, each set at a time, through a two-sample Kolmogorov–Smirnoff test. Since the redshift range of LGRBs in the BAT6ext is much broader than that of SGRBs in SBAT4 (zmax ∼ 5.9 for LGRBs vs. zmax ∼ 2.2 for SGRBs), we cut the BAT6ext simulated NH distribution at z ∼ 2.3, in order to compare the two distributions in the same redshift bin. The two-sample K–S resulted in a logarithmic mean probability of 1.4 × 10⁻⁴ and a median of 3.3 × 10⁻³.
We then cut both the SBAT4 and BAT6ext distributions from z = 0.5 to z = 2.3 in steps of 0.1, filling the plot in Fig. 3, in order to test how the probability varied as a function of the redshift cut.
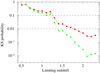 |
Fig. 3. K–S probability evaluated between the two populations of LGRBs in the BAT6ext (from Arcodia et al. (2016)) and the SBAT4, as a function of the applied cut in z. Red dots represent the median value of the obtained K–S probability distribution, while green dots are their logarithmic mean value. As the redshift range increases, the probability follows a decreasing trend. The two populations are likely drawn from the same distribution up to z ∼ 1.2, then the probability crosses a band (between the green dashed lines, corresponding to a probability of 1% to 10%) where the K–S test is ambiguous, and keeps decreasing. At z ∼ 1.4 the logarithmic mean of the K–S probability has dropped below the 1% threshold, and at z ∼ 1.8 also the median value indicates that the two populations are likely different. |
We also split the two datasets into two different redshift bins 0–0.7 and 0.7–2.3, and carried out the K–S test separately (this is because the two distributions populate the redshift span differently and we wanted to test if this difference has an effect). The results confirm our findings: the two distributions within the 0–0.7 redshift bin are comparable whereas in the 0.7–2.3 redshift bin are different at more than 3σ level. Finally, we added a heavily absorbed SGRBs to the sample by hand, with NH(z) = 1023 cm−2 at z = 1.5. We then ran again the entire Monte Carlo simulation. The inclusion of this single heavily absorbed SGRB weakens considerably the K–S results with a median overall probability of ∼10−2. As a further check, we also repeated the simulations using the redshift distribution presented in Ghirlanda et al. (2016), that is representative of the whole SGRB population, finding a logarithmic mean probability of 2.5 × 10⁻³ and a median of 3.0 × 10⁻³, in agreement with the results reported above.
5. Discussion
Previous works found that the populations of LGRBs and SGRBs are different when considered without any restriction in redshift, but consistent when compared in the z ∼ 0 − 1 range, that was the range of their SGRB samples (Kopač et al. 2012; Margutti et al. 2012; D’Avanzo et al. 2014). The consistency of the two distributions of NH up to z ∼ 1 was interpreted as evidence that the majority of SGRB progenitors evolve via the fast-merging channel, that is, they share a similar environment with LGRBs, with the caution that column densities, being integrated quantities, are a good proxy for the host-galaxy properties and not of the circumburst medium. Under this hypothesis, one would expect that the extension of the sample to z ∼ 2.2 would confirm the consistency of the two distributions of NH. Instead, we find that the two populations become more and more distinguishable when compared in a redshift range that is above the z ∼ 1.3 threshold, with SGRBs being less absorbed. This may be due to the fact that above z ∼ 1 Fig. 1 is populated by highly absorbed LGRBs. Although the definition of dark LGRBs is not based on X-ray absorption (see Sect. 3), Campana et al. (2012), Fynbo et al. (2001), Jakobsson et al. (2004), and Van der Horst et al. (2009) showed that there is a strong correlation between the darkness of these events and their high NH value and that they are likely due to absorption occurring in the circumburst medium. No SGRB with such high NH ∼ 1023 cm−2 is observed at the same redshift (between z ∼ 1.3 and z ∼ 2.1), as one would expect if the two environments were substantially different, at least beyond z ∼ 1.3. We note, however, that the lack of heavily absorbed SGRB with known redshift might be due to an observational bias. The dense medium in which heavily absorbed GRBs occur can suppress the optical afterglow emission, making the optical afterglows of SGRBs occurring in such a dense medium too faint to be detected by current facilities. Besides this would result in less accurate positions (that would be only X-ray based) that would make difficult to securely associate a host galaxy (almost all SGRB redshifts measured so far have been obtained from optical spectroscopy of their host galaxies).
Redshift-selection effects may indeed play a role in our results, biasing the SBAT4 sample towards less-absorbed (and thus observable) SGRBs at z ≳ 1. If, however, the indication for a difference in absorption that we find were indeed intrinsic, our results cannot discern between the expectations deriving from the primordial binary and the dynamical formation scenarios, since they both predict lower NH values for SGRBs with respect to LGRBs. Indeed, the use of column densities alone cannot discriminate whether such a difference in absorption (which may also be due to different density, metallicity, or abundances) is caused by the host galaxies properties of the two populations (Buchner et al. 2016), by a difference in the subgalactic environments where the GRBs occur, or by different selection effects. However, both the possibilities of different host galaxy type and/or different environment indirectly suggest that LGRBs and SGRBs do not share the same progenitors.
6. Conclusions
The evaluation of the column densities for the population of SGRBs is an indirect tool to probe the consistency of the compact object merger model, alongside the direct proof that is the simultaneous detection of an SGRB and a gravitational wave source (Abbott et al. 2017). The comparison between the NH distribution of SGRBs and that of LGRBs is supposed to highlight the discrepancy in absorption that is predicted by the different progenitor scenarios for the two populations. Given the typical faintness of SGRB afterglows, this comparison should be carried out on homogeneous samples that reduce any selection bias due to redshift or X-ray afterglow properties. These features are found in the SBAT4 for SGRBs (D’Avanzo et al. 2014) and in the BAT6ext for LGRBs (Salvaterra et al. 2012; Pescalli et al. 2016), since they are complete flux-limited samples that well represent the whole bright populations of their respective GRB classes. In this paper we extended the SBAT4 flux-limited sample to 25 events, raising its redshift range from z ∼ 1.3 to z = 2.2 (Selsing et al. 2018). We then computed the column density values of the ∼50% of the sample which had a redshift measurement, obtaining six detections and seven upper limits. We used Monte Carlo simulations of the populations of SBAT4 and BAT6ext (Salvaterra et al. 2012; Pescalli et al. 2016; Arcodia et al. 2016) to overcome the low statistics, approximating the probability distribution for each measurement as a Gaussian and thus assuming a symmetrical error. By using the observed redshift distribution of the SBAT4 sample (D’Avanzo et al. 2014; Ghirlanda et al. 2016) we were able to include also the events that lacked a redshift association. We were hence able to make a comparison between the two NH distributions, which was carried out by a two-sample K–S test. We first studied the whole SBAT4 and BAT6ext in the same redshift bin (z ∼ 2.3), obtaining that the two populations are unlikely drawn from the same distribution. We then compared the two samples, applying to both a cut in redshift from z = 0.5 to z = 2.2 in steps of 0.1. Our results up to z ∼ 1.3 are consistent with previous works, that is, the two populations are indistinguishable from each other. The K–S probability value continues decreasing, until at z ∼ 1.8 (z ∼ 1.4, if we rely on the logarithmic mean value only) the two parent distributions are significantly different (below 1%), and become more and more distinct the higher the redshift cut is placed. These results suggest that SGRBs are absorbed less than LGRBs, as one would expect if the environments where they occurred were less dense, and they are in agreement with what is predicted by the merger scenario, both through the primordial binary or the dynamical evolutionary channels. However, this difference in absorption does not emerge firmly until z ∼ 1.8 (1.4 for logarithmic mean only) and is totally absent until z ∼ 1. This might indicate that the fast merging channel for SGRBs is less effective starting from z ≳ 1. Alternatively, this may mirror the fact that the presence of the so-called dark LGRBs (Campana et al. 2012; Fynbo et al. 2001; Jakobsson et al. 2004; Van der Horst et al. 2009) in the redshift range between z ∼ 1.3 − 2.2 that may be causing the two distributions to part. This is indeed confirmed by the fake addition of a heavily absorbed SGRB to the simulated sample: the difference between the two populations vanishes. Hence, the current instrumental challenge to detect heavily absorbed SGRB at z ≳ 1 may be biasing the sample towards less absorbed events. Future updates of the SBAT4, possibly with an increase in redshift completeness and range, may continue these studies, enriching the statistics about these events.
Mergers should be kicked out of the star-forming region, but also towards the center of the host galaxy or behind it along our line of sight, possibly increasing the overall column density.
To select BAT6 and BAT6ext, a peak photon flux P ≳ 2.6 ph s−1 cm−2 in the prompt emission was required. The light curve was binned at 1 s resolution.
Acknowledgments
We thank R. Arcodia for useful discussions. We thank the anonymous referee for useful comments. This work made use of data supplied by the UK Swift Science Data Centre at the University of Leicester. We also acknowledge support from ASI grant I/004/11/3.
References
- Abbott, B., Abbott, R., Adhikari, R., et al. 2017, ApJ, 848, L12 [Google Scholar]
- Arcodia, R., Campana, S., & Salvaterra, R. 2016, A&A, 590, A82 [NASA ADS] [CrossRef] [EDP Sciences] [Google Scholar]
- Arcodia, R., Campana, S., Salvaterra, R., & Ghisellini, G. 2018, A&A, 616, A170 [NASA ADS] [CrossRef] [EDP Sciences] [Google Scholar]
- Arnaud, K. 1996, ASP Conf. Ser., 101, 17 [Google Scholar]
- Belczyński, K., & Kalogera, V. 2001, ApJ, 550, L183 [NASA ADS] [CrossRef] [Google Scholar]
- Belczynski, K., Perna, R., Bulik, T., et al. 2006, ApJ, 648, 1110 [NASA ADS] [CrossRef] [Google Scholar]
- Buchner, J., Schulze, S., & Bauer, F. E. 2016, MNRAS, 464, 4545 [Google Scholar]
- Burgay, M., D’amico, N., Possenti, A., et al. 2003, Nature, 426, 531 [NASA ADS] [CrossRef] [PubMed] [Google Scholar]
- Butler, N. R., & Kocevski, D. 2007, ApJ, 663, 407 [NASA ADS] [CrossRef] [Google Scholar]
- Campana, S., Lazzati, D., Ripamonti, E., et al. 2007, ApJ, 654, L17 [NASA ADS] [CrossRef] [Google Scholar]
- Campana, S., Thöne, C., de Ugarte Postigo, A., et al. 2010, MNRAS, 402, 2429 [NASA ADS] [CrossRef] [Google Scholar]
- Campana, S., Salvaterra, R., Melandri, A., et al. 2012, MNRAS, 421, 1697 [NASA ADS] [CrossRef] [Google Scholar]
- Campana, S., Bernardini, M., Braito, V., et al. 2014, MNRAS, 441, 3634 [NASA ADS] [CrossRef] [Google Scholar]
- Cano, Z., Wang, S.-Q., Dai, Z.-G., & Wu, X.-F. 2017, Adv. Astron., 2017, 8929054 [NASA ADS] [CrossRef] [Google Scholar]
- Cash, W. 1979, ApJ, 228, 939 [NASA ADS] [CrossRef] [Google Scholar]
- D’Avanzo, P., Salvaterra, R., Bernardini, M., et al. 2014, MNRAS, 442, 2342 [NASA ADS] [CrossRef] [Google Scholar]
- Eichler, D., Livio, M., Piran, T., & Schramm, D. N. 1989, Nature, 340, 126 [NASA ADS] [CrossRef] [Google Scholar]
- Evans, P., Beardmore, A., Page, K., et al. 2009, MNRAS, 397, 1177 [NASA ADS] [CrossRef] [Google Scholar]
- Fong, W.-F., Berger, E., Margutti, R., & Zauderer, B. A. 2015, ApJ, 815, 102 [NASA ADS] [CrossRef] [Google Scholar]
- Fynbo, J., Jensen, B., Gorosabel, J., et al. 2001, A&A, 369, 373 [NASA ADS] [CrossRef] [EDP Sciences] [Google Scholar]
- Galama, T. J., & Wijers, R. A. 2001, ApJ, 549, L209 [NASA ADS] [CrossRef] [Google Scholar]
- Ghirlanda, G., Salafia, O., Pescalli, A., et al. 2016, A&A, 594, A84 [NASA ADS] [CrossRef] [EDP Sciences] [Google Scholar]
- Goldstein, A., Veres, P., Burns, E., et al. 2017, ApJ, 848, L14 [NASA ADS] [CrossRef] [Google Scholar]
- Grindlay, J., Zwart, S. P., & McMillan, S. 2006, Nat. Phys., 2, 116 [NASA ADS] [CrossRef] [Google Scholar]
- Heintz, K., Watson, D., Jakobsson, P., et al. 2018, MNRAS, 479, 3456 [NASA ADS] [CrossRef] [Google Scholar]
- Hjorth, J., & Bloom, J. 2012, Cambridge Astrophys. Ser., 51, 169 [Google Scholar]
- Jakobsson, P., Hjorth, J., Fynbo, J., et al. 2004, ApJ, 617, L21 [NASA ADS] [CrossRef] [Google Scholar]
- Kopač, D., D’Avanzo, P., Melandri, A., et al. 2012, MNRAS, 424, 2392 [NASA ADS] [CrossRef] [Google Scholar]
- Kouveliotou, C., Meegan, C. A., Fishman, G. J., et al. 1993, ApJ, 413, L101 [NASA ADS] [CrossRef] [Google Scholar]
- Margutti, R., Zaninoni, E., Bernardini, M., et al. 2012, MNRAS, 425, 1199 [NASA ADS] [CrossRef] [Google Scholar]
- Melandri, A., Sbarufatti, B., D’Avanzo, P., et al. 2012, MNRAS, 421, 1265 [NASA ADS] [CrossRef] [Google Scholar]
- Nakar, E. 2007, Phys. Rep., 442, 166 [NASA ADS] [CrossRef] [Google Scholar]
- Narayan, R., Paczyński, B., & Piran, T. 1992, ApJ, 395, L83 [NASA ADS] [CrossRef] [Google Scholar]
- Perna, R., & Belczynski, K. 2002, ApJ, 570, 252 [NASA ADS] [CrossRef] [Google Scholar]
- Pescalli, A., Ghirlanda, G., Salvaterra, R., et al. 2016, A&A, 587, A40 [NASA ADS] [CrossRef] [EDP Sciences] [Google Scholar]
- Salvaterra, R., Cerutti, A., Chincarini, G., et al. 2008, MNRAS, 388, L6 [NASA ADS] [Google Scholar]
- Salvaterra, R., Campana, S., Vergani, S. D., et al. 2012, ApJ, 749, 68 [NASA ADS] [CrossRef] [Google Scholar]
- Sari, R., & Piran, T. 1999, ApJ, 520, 641 [NASA ADS] [CrossRef] [Google Scholar]
- Savchenko, V., Ferrigno, C., Kuulkers, E., et al. 2017, ApJ, 848, L15 [NASA ADS] [CrossRef] [Google Scholar]
- Schady, P., Savaglio, S., Krühler, T., Greiner, J., & Rau, A. 2011, A&A, 525, A113 [NASA ADS] [CrossRef] [EDP Sciences] [Google Scholar]
- Selsing, J., Krühler, T., Malesani, D., et al. 2018, A&A, 616, A48 [NASA ADS] [CrossRef] [EDP Sciences] [Google Scholar]
- Van der Horst, A., Kouveliotou, C., Gehrels, N., et al. 2009, ApJ, 699, 1087 [NASA ADS] [CrossRef] [Google Scholar]
- Verner, D., Ferland, G., Korista, K., & Yakovlev, D. 1996, ApJ, 465, 487 [NASA ADS] [CrossRef] [Google Scholar]
- Wang, F.-F., Zou, Y.-C., Liu, Y., Liao, B., & Moharana, R. 2018, J. High Energy Astrophys., 18, 21 [NASA ADS] [CrossRef] [Google Scholar]
- Watson, D., Hjorth, J., Fynbo, J. P. U., et al. 2007, ApJ, 660, L101 [NASA ADS] [CrossRef] [Google Scholar]
- Willingale, R., Starling, R., Beardmore, A. P., Tanvir, N. R., & O’Brien, P. T. 2013, MNRAS, 431, 394 [NASA ADS] [CrossRef] [Google Scholar]
- Wilms, J., Allen, A., & McCray, R. 2000, ApJ, 542, 914 [NASA ADS] [CrossRef] [Google Scholar]
All Tables
All Figures
|
Fig. 1. Column density values of the SBAT4 (blue) and the values of the BAT6ext (red) from Arcodia et al. (2016). Down-pointing arrows represent upper limits for both the populations. Although the numbers of SGRBs is low, the distribution of NH of the events in SBAT4 seems to track that of BAT6ext until z ∼ 1.3, where LGRBs are slightly more absorbed, and some heavily absorbed LGRBs fill the top region of the plot. |
| In the text | |
|
Fig. 2. Upper panel: βOX for the short GRBs of the SBAT4 sample. Upper limits are shown with a down-pointing arrow. The horizontal line marks the limit of GRB darkness. Medium panel: βOX as a function of redshift. GRBs with unknown redshift are shown at z = 0. Lower panel: βOX as a function of the intrinsic column density. Down-pointing arrows indicate upper limits on β. Right-pointing arrows indicate GRBs with unknown redshift for which the column density has been computed at z = 0. |
| In the text | |
|
Fig. 3. K–S probability evaluated between the two populations of LGRBs in the BAT6ext (from Arcodia et al. (2016)) and the SBAT4, as a function of the applied cut in z. Red dots represent the median value of the obtained K–S probability distribution, while green dots are their logarithmic mean value. As the redshift range increases, the probability follows a decreasing trend. The two populations are likely drawn from the same distribution up to z ∼ 1.2, then the probability crosses a band (between the green dashed lines, corresponding to a probability of 1% to 10%) where the K–S test is ambiguous, and keeps decreasing. At z ∼ 1.4 the logarithmic mean of the K–S probability has dropped below the 1% threshold, and at z ∼ 1.8 also the median value indicates that the two populations are likely different. |
| In the text | |
Current usage metrics show cumulative count of Article Views (full-text article views including HTML views, PDF and ePub downloads, according to the available data) and Abstracts Views on Vision4Press platform.
Data correspond to usage on the plateform after 2015. The current usage metrics is available 48-96 hours after online publication and is updated daily on week days.
Initial download of the metrics may take a while.