Fig. 3.
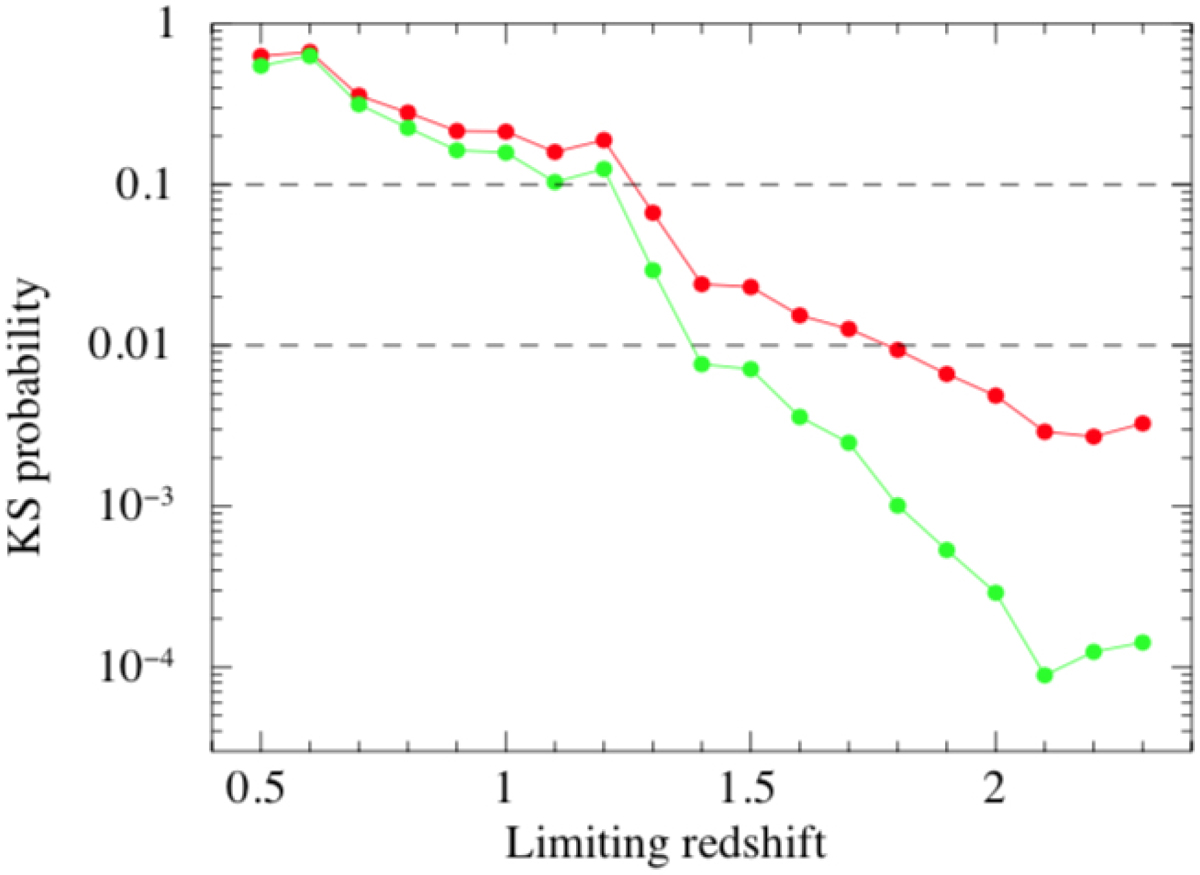
K–S probability evaluated between the two populations of LGRBs in the BAT6ext (from Arcodia et al. (2016)) and the SBAT4, as a function of the applied cut in z. Red dots represent the median value of the obtained K–S probability distribution, while green dots are their logarithmic mean value. As the redshift range increases, the probability follows a decreasing trend. The two populations are likely drawn from the same distribution up to z ∼ 1.2, then the probability crosses a band (between the green dashed lines, corresponding to a probability of 1% to 10%) where the K–S test is ambiguous, and keeps decreasing. At z ∼ 1.4 the logarithmic mean of the K–S probability has dropped below the 1% threshold, and at z ∼ 1.8 also the median value indicates that the two populations are likely different.
Current usage metrics show cumulative count of Article Views (full-text article views including HTML views, PDF and ePub downloads, according to the available data) and Abstracts Views on Vision4Press platform.
Data correspond to usage on the plateform after 2015. The current usage metrics is available 48-96 hours after online publication and is updated daily on week days.
Initial download of the metrics may take a while.