Fig. 1.
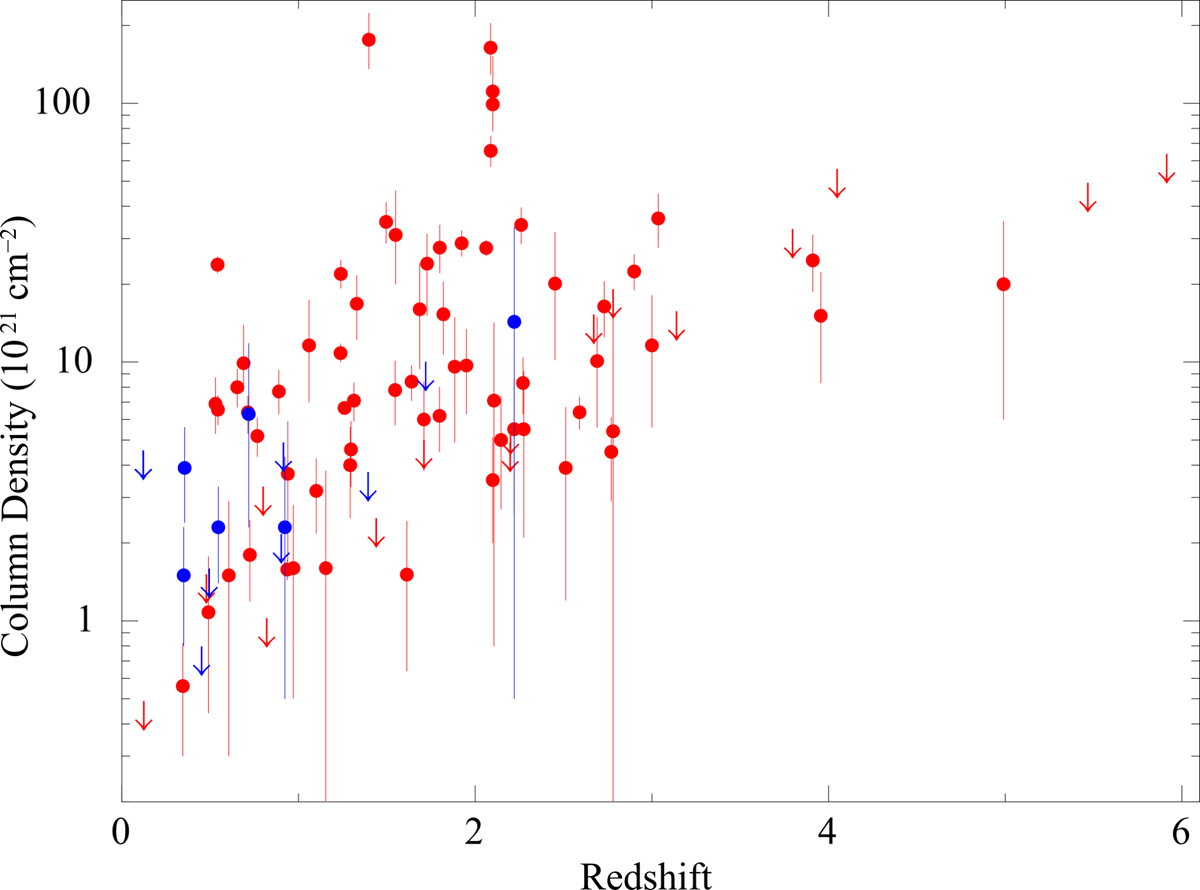
Column density values of the SBAT4 (blue) and the values of the BAT6ext (red) from Arcodia et al. (2016). Down-pointing arrows represent upper limits for both the populations. Although the numbers of SGRBs is low, the distribution of NH of the events in SBAT4 seems to track that of BAT6ext until z ∼ 1.3, where LGRBs are slightly more absorbed, and some heavily absorbed LGRBs fill the top region of the plot.
Current usage metrics show cumulative count of Article Views (full-text article views including HTML views, PDF and ePub downloads, according to the available data) and Abstracts Views on Vision4Press platform.
Data correspond to usage on the plateform after 2015. The current usage metrics is available 48-96 hours after online publication and is updated daily on week days.
Initial download of the metrics may take a while.