Fig. 2.
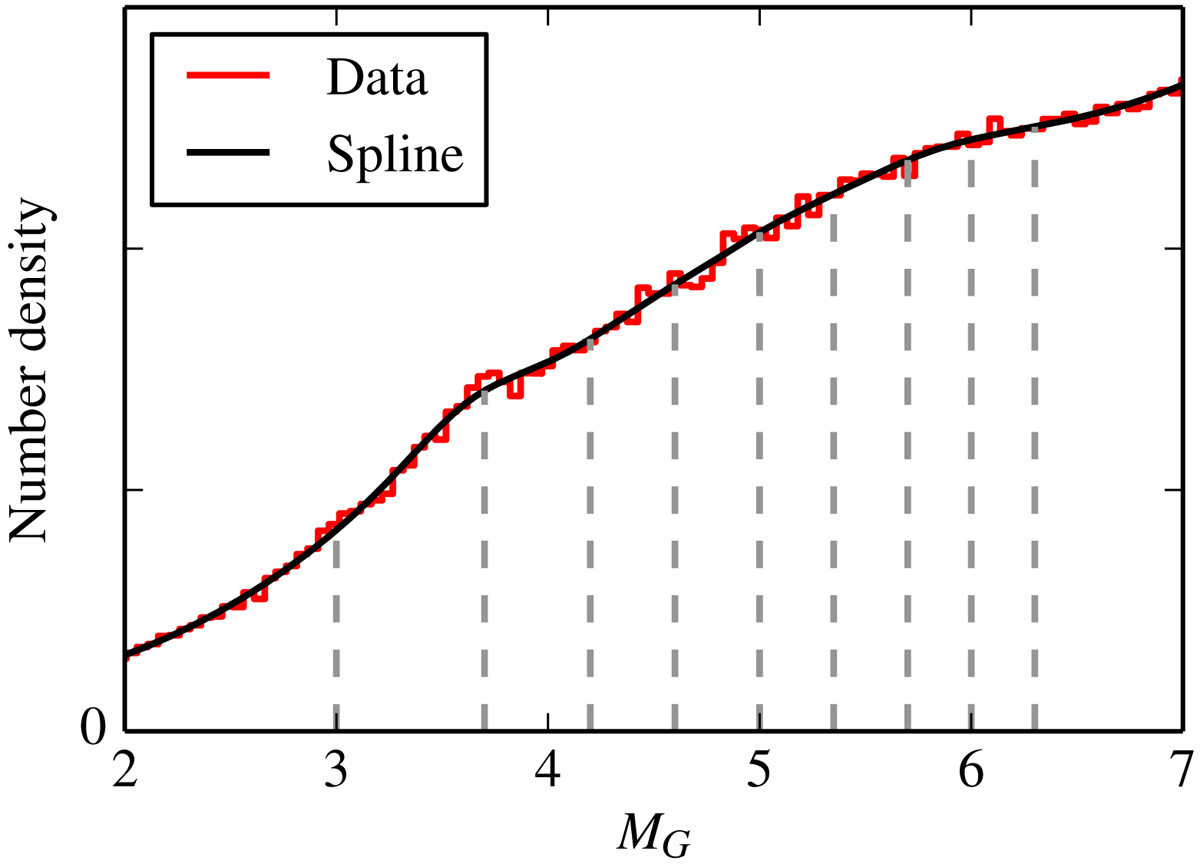
Luminosity function F(MG), describing the number density of stars in the solar neighbourhood, as a function of absolute magnitude in the GaiaG-band. The solid lines are the binned data and the spline function F(MG). The dashed lines correspond to the absolute magnitude bounds by which the four data samples are constructed. The function is not normalised and need not be.
Current usage metrics show cumulative count of Article Views (full-text article views including HTML views, PDF and ePub downloads, according to the available data) and Abstracts Views on Vision4Press platform.
Data correspond to usage on the plateform after 2015. The current usage metrics is available 48-96 hours after online publication and is updated daily on week days.
Initial download of the metrics may take a while.