Fig. 1.
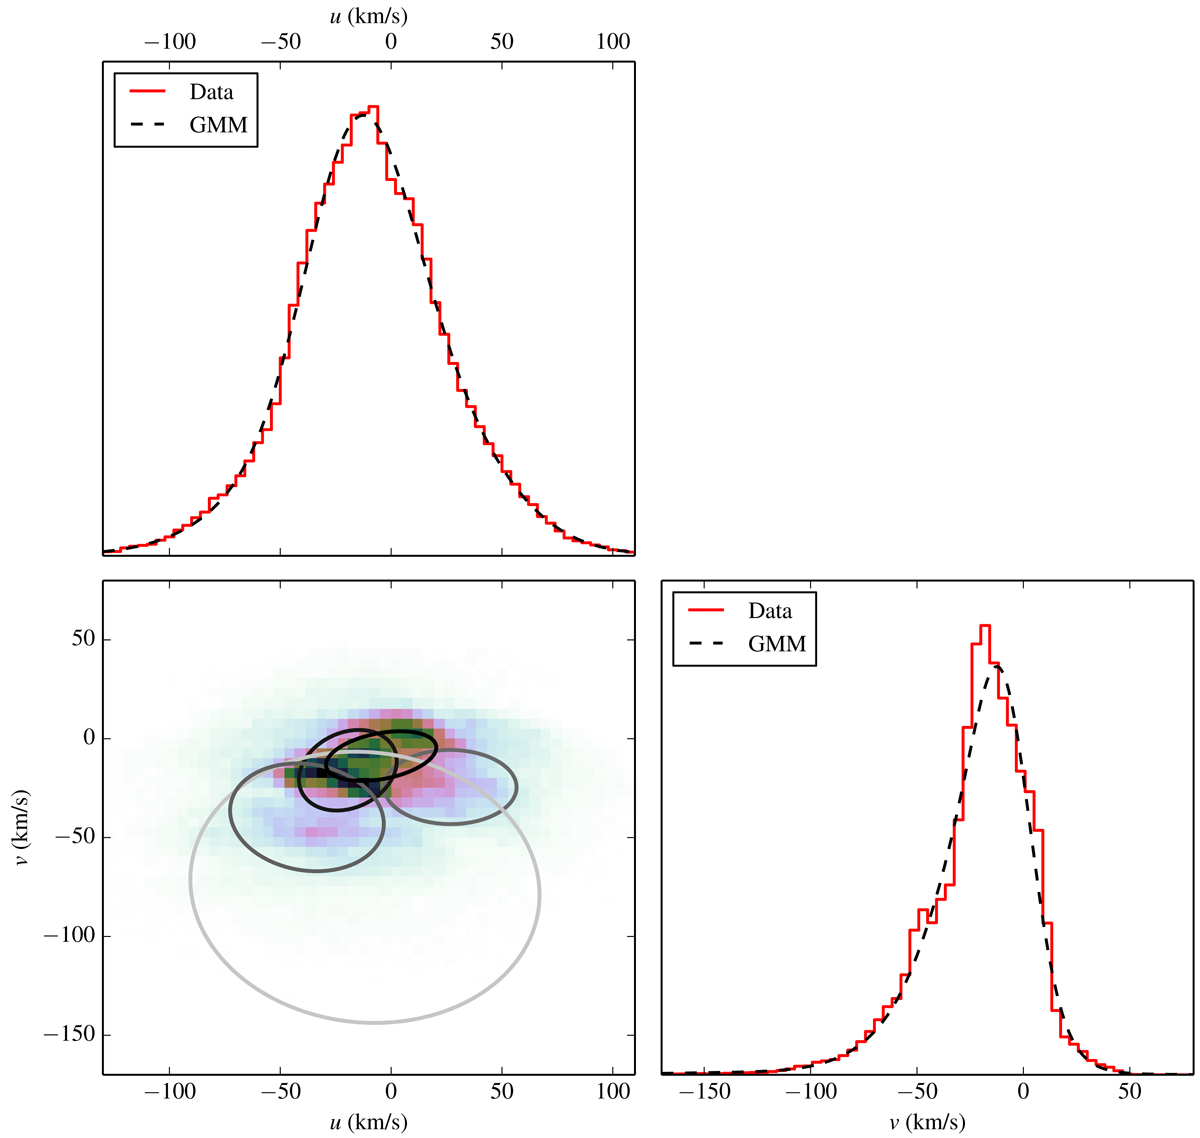
Gaussian mixture model and data over u and v velocities. Bottom-left panel: data is plotted as a 2D histogram, overlaid by the 1-sigma ellipses of the five Gaussians of the mixture model. The shading of the ellipses correspond to the weight of the respective Gaussians, where a darker colour correspond to a larger weight. Top and bottom-right panels: fitted model and the data are marginalised to 1D histograms over u and v.
Current usage metrics show cumulative count of Article Views (full-text article views including HTML views, PDF and ePub downloads, according to the available data) and Abstracts Views on Vision4Press platform.
Data correspond to usage on the plateform after 2015. The current usage metrics is available 48-96 hours after online publication and is updated daily on week days.
Initial download of the metrics may take a while.