| Issue |
A&A
Volume 623, March 2019
|
|
|---|---|---|
| Article Number | A90 | |
| Number of page(s) | 11 | |
| Section | Stellar structure and evolution | |
| DOI | https://doi.org/10.1051/0004-6361/201833922 | |
| Published online | 08 March 2019 | |
A LOFAR search for steep-spectrum pulsars in supernova remnants and pulsar wind nebulae
1
Anton Pannekoek Institute for Astronomy, University of Amsterdam, Science Park 904, PO Box 94249, 1090 GE Amsterdam, The Netherlands
e-mail: This email address is being protected from spambots. You need JavaScript enabled to view it.
2
ASTRON, The Netherlands Institute for Radio Astronomy, PO Box 2, 7790 AA Dwingeloo, The Netherlands
Received:
21
July
2018
Accepted:
16
January
2019
Abstract
Pinpointing a pulsar in its parent supernova remnant (SNR) or resulting pulsar wind nebula (PWN) is key to understanding its formation history and the pulsar wind mechanism, yet only about half the SNRs and PWNe appear associated with a pulsar. Our aim was to find the pulsars in a sample of eight known and new SNRs and PWNe. Using the LOFAR radio telescope at 150 MHz, each source was observed for 3 h. We covered the entire remnants where needed, by employing many tied-array beams to tile out even the largest objects. For objects with a confirmed point source or PWN we constrained our search to those lines of sight. We identified a promising radio pulsar candidate towards PWN G141.2+5.0. The candidate, PSR J0337+61, has a period of 94 ms and a DM of 226 pc cm−3. We re-observed the source twice with increased sensitivities of 30% and 50%, but did not re-detect it. It thus remains unconfirmed. For our other sources we obtain very stringent upper limits of 0.8 − 3.1 mJy at 150 MHz. Generally, we can rule out that the pulsars travelled out of the remnant. From these strict limits we conclude our non-detections towards point sources and PWNe are the result of beaming and propagation effects. Some of the remaining SNRs should host a black hole rather than a neutron star.
Key words: pulsars: general / ISM: supernova remnants
© ESO 2019
1. Introduction
Finding young pulsars in their supernova remnants (SNRs) is important for studying pulsar formation and the supernova explosion mechanism. The most energetic pulsars (Ė ⪆ 1036 erg s−1) produce a wind of highly relativistic particles which results in a pulsar wind nebula (PWN). In PWNe the presence of a pulsar is beyond doubt. However, in only about half of the known SNRs and PWNe are pulsars seen (Roberts 2004; Green 2014).
Neutron stars (NSs) are formed in core-collapse supernova remnants (cc-SNRs). For solar metallicity environments, the fraction of supernovae that produce a NS lies between 75% and 87%, depending on the lower mass limit used for fall-back black hole formation (Heger et al. 2003). These young NSs come in different forms. They can be observed in the high-energy band as central compact objects (CCOs), a class of weakly magnetised neutron stars unable to produce non-thermal emission or a wind nebula (see e.g. De Luca 2017 for a recent review). Alternatively, they can be highly magnetized and observable as magnetars; however, if the majority of young NSs emit in the radio as rotation-powered pulsars (Keane & Kramer 2008), the lack of detections of associated pulsars can be explained in two ways. Firstly, missing these sources may follow from some fundamental hurdles, for example the beam of the pulsar might not be pointed towards the Earth, causing us to miss the pulse. Secondly, instrumental limitations may prevent us from detecting these pulsars.
Previous pulsar searches towards SNRs and PWNe have mostly been conducted with single-dish telescopes using one or more beams, at central frequencies around 600 and 1400 MHz, to counter the propagation effects of the Galactic plane. These systems have fields of view (FoVs) smaller than many SNRs and PWNe. It is thus necessary to observe with shorter integration times in multiple epochs. This results in less sensitive observations overall. To reach the required sensitivity, observers are often forced to focus only on the central area of the SNR, causing them to miss any pulsars that might have travelled The LOw Frequency ARray (LOFAR) has a large instantaneous FoV, which allows us to cover even the largest SNRs in a single observation (van Haarlem et al. 2013). LOFAR is an interferometric radio array spread out over Europe and operating between 10 and 250 MHz. The Low Band Array (LBA) covers the frequencies from 10 to 90 MHz, while the High Band Array (HBA) can observe between 110 and 250 MHz.
Observing in this long-wavelength range can be a boon. Pulsars are known to have steep flux-density spectra, making them brighter at low frequencies. When expressed as a power law Sν ∝ να, previous studies have obtained average spectral indices of α = −1.6 ± 0.3 (Lorimer et al. 1995), α = −1.8 ± 0.2 (Maron et al. 2000), and α = −1.4 ± 1 (Bates et al. 2013). These indices were, however, obtained from observations well above 100 MHz. From pulsar flux densities in the 102−400 MHz range, Malofeev et al. (2000) obtained a mean spectral index of α = −1.47 ± 0.76 and more recently, Bilous et al. (2016) have found a mean spectral index of  for non-recycled pulsars observed with LOFAR around 150 MHz. In our study we would like to compare our sensitivity estimates to those of previous searches; we adopt α = −1.4, which seems to correspond well to spectral slopes at higher and lower frequencies (Malofeev et al. 2000; Bates et al. 2013; Bilous et al. 2016). A further advantage is that normal pulsars have a spectral turnover around 130 MHz, and hence their flux density “peaks” at these low frequencies (cf. Izvekova et al. 1981; Malofeev et al. 2000). This makes the 110−180 MHz band well suited to searching for pulsars. Finally, at low frequencies more pulsars may be beamed towards us. As lower frequencies are emitted higher up in the pulsar magnetosphere, pulsar beams are wider at lower frequencies, thus increasing the chance of a detection. Such widening of pulse profiles at low frequencies was confirmed for the LOFAR sample by Pilia et al. (2016).
Downsides to low-frequency observing are equally present, in the form of elevated sky background noise and increased pulse scattering. However, the benefits of the brighter emission at low radio frequencies, and the broader beams, may outweigh these disadvantages and increase the overall chance of detection.
We observed eight known and new SNRs and PWNe at low radio frequencies to search for associated pulsars. In Sect. 2 we describe our source selection. Our observations and data reduction are described in Sect. 3 and we present our results in Sect. 4. A candidate detection prompted re-observations, which we describe in Sect. 5. We discuss our results in Sect. 6 and conclude in Sect. 7.
2. Source background and selection
We selected SNRs and PWNe that have no associated pulsar or black hole and are likely the result of a cc-SN. We also included sources with a CCO as this class might be radio-faint rather than radio-quiet. We selected those sources that have ages ⪅ a few times 105 years as Gaensler & Johnston (1995) find that for systems up to that age associations may still exist. Only those targets were selected that are within the part of the sky where LOFAR is most sensitive (declination >10 deg). By next limiting our search to relatively nearby sources (d ⪅ 6 kpc), the expected propagation effects on the pulsar signal are within the range of observing capabilities of LOFAR. For that range, the dispersion can be accommodated by the channel width (see Sect. 5); and as new pulsars are detected out to that distance in the LOFAR LOTAAS survey (Cooper 2017), the flux densities should be well within range of the sensitivity attained in our 3× longer integrations (demonstrated in more detail in Sect. 6.2.4).
Based on these criteria, targets were selected from the online SNR catalogue1 (Ferrand & Safi-Harb 2012) and Green’s SNR catalogue2 (Green 2014). Below we describe the selected sources, and the relevant existing research, including previously conducted pulsar searches. Parameters are quoted as given in the cited work.
2.1. G49.2–0.7
Also known as W51C, G49.2−0.7 is a middle-aged SNR (∼30 kyr, Koo et al. 1995). It lies in the W51 complex that also consists of H II region W51A and the massive-star forming region W51B (Tian & Leahy 2013).
Previously, Tian & Leahy (2013) and Koo et al. (1995) had placed the SNR at a distance of 4.3 kpc and ∼6 kpc, respectively. This has recently been revised to 5.4 kpc (Ranasinghe & Leahy 2018), which we adopt in this work. At this distance, the angular diameter of the source (∼30′; Copetti & Schmidt 1991) translates to a physical size of 47 pc.
Koo et al. (2002) observed the complex with ASCA and identified a hard X-ray source, CXO J192318.5+1403035, as a candidate PWN. Further Chandra observations by Koo et al. (2005) show that the structure of the hard X-ray source consists of a diffuse envelope and a core containing a compact source, presumably the powering pulsar.
G49.2−0.7 had previously been searched by Gorham et al. (1996) with Arecibo at 430 MHz and 1420 MHz, yet only the central 15% and 2% of the remnant were respectively covered and searched down to minimum sensitivities (Smin) of 0.6 mJy and 0.5 mJy. This search did not cover the hard X-ray source.
The location of G49.2−0.7 in a star-formation region makes it a likely cc-SNR and thus a good target to search for a possible pulsar association.
2.2. G63.7+1.1
G63.7+1.1 was discovered by Taylor et al. (1992) and confirmed as a plerionic (filled-centre) SNR by Wallace et al. (1997), who also determined the kinematic distance to the source to be 3.8 ± 1.5 kpc based on associated H I and CO features.
Recently, G63.7+1.1 was observed in X-rays for the first time by Matheson et al. (2016) with XMM-Newton and Chandra. They aimed to detect the PWN and to search for the associated neutron star. Matheson et al. (2016) find clear evidence of an X-ray nebula and suggest that the CXO J194753.3+274351, located near the peak of the X-ray emission of the remnant, is the powering neutron star. Additionally, Matheson et al. (2016) provide an updated distance to the source of 5.8 ± 0.9 kpc. The diameter of the radio nebula of 8′ then translates to a physical size of 14 pc. Assuming the pulsar was born at the peak of the radio luminosity and then travelled to the location of the X-ray peak, applying the average observed 2D pulsar speed of 246 ± 22 km s−1 (Hobbs et al. 2005) leads to an age estimate of roughly ∼8 kyr.
Even though Matheson et al. (2016) provide estimates for the putative pulsar energetics, no search for an associated pulsar has been reported.
2.3. G65.3+5.7
G65.3+5.7 (also known as G65.2+5.7) is a large SNR, with major axes of 310′×240′, discovered by Gull et al. (1977). The distance to the remnant, derived from the velocity of optical line emission, is ∼0.8−1.0 kpc (Lozinskaya 1981). This value is consistent with a previous estimate of  kpc based on the diameter and surface brightness (Σ−D) relation by Reich et al. (1979). Both distances agree well with that expected from its X-ray luminosity (Schaudel et al. 2002). At this distance the physical size is estimated to be
  pc, at an age of less than ∼2.4 × 10⁵ yr.
A radio pulsar search at 1420 MHz by Gorham et al. (1996) covered the inner 3′ of the remnant, and did not detect any pulsars down to a sensitivity of 0.1 mJy. However, this non-detection is not very constraining as a transverse velocity of vtrans = 20 km s−1 would be sufficient to move the neutron star out of the searched area. Outside the area searched by Gorham et al. (1996), and Camilo et al. (1996) found a 0.58 s pulsar at 45′ from the centre of the remnant with a flux density of 1.9 mJy at 606 MHz. This pulsar (J1931+30) seems too slow-spinning to be associated with the remnant. It is possible that a slow-spinning pulsar is formed; however, its dispersion measure (56 ± 5 pc cm−3) suggests a distance of 3.4 kpc (NE2001; Cordes & Lazio 2002), three times further than the remnant. As the remnant is located in a low ambient matter density environment (Schaudel et al. 2002), this DM discrepancy suggests the pulsar is not associated with the SNR. G65.3+5.7 was part of the sample of six large-diameter SNRs in which Kaplan et al. (2006) aimed to identify X-ray point sources from the ROSAT. Bright Source Catalogue in and near the SNRs to find the associated neutron star. Down to a luminosity of ∼1032 ergs s−1 no associated neutron star was found.
2.4. G74.9+1.2
G74.9+1.2 is a plerionic SNR, also known as CTB 87. Matheson et al. (2013) reveal a compact X-ray nebula, 100″ offset from the radio peak. The nebula shows a torus/jet-like structure, which indicates its origin as a pulsar wind nebula. The putative pulsar would then be located at the detected point source CXOU J201609.2+371110. The observed properties in Matheson et al. (2013) suggest that the source has an age of ∼5−28 kyr.
Kothes et al. (2003) show that a previous distance determination of 12 kpc (Green & Gull 1989; Wallace et al. 1997) is erroneous due to the assumption of a flat Galactic rotation curve in the direction of G74.9+1.2. By applying the extinction-distance relation introduced by Foster & Routledge (2003) the distance is adjusted to 6.1 ± 0.9 kpc. This value is in excellent agreement with distance determinations using the thermal electron model of Taylor & Cordes (1993). The remnant size of 8′ × 6′ (Green 2009) implies a physical size of ∼14 × 11 pc at a distance of 6.1 kpc.
Although Matheson et al. (2013) detect an X-ray point source, previous searches have not found a radio pulsar. Gorham et al. (1996) fully searched G74.9+1.2 using the Arecibo radio telescope at 430 MHz and reached a sensitivity of 0.4 mJy. Biggs & Lyne (1996) searched the source at 606 MHz using the 76m Lovell radio telescope. They did not find a pulsar down to a flux density of 10 mJy. The source was again searched, but deeper, by Lorimer et al. (1998) with the 76 m Lovell radio telescope at 606 MHz with an 8 MHz bandwidth. They obtained an upper limit of Smin = 1.1 mJy.
2.5. G93.3+6.9
G93.3+6.9, also known as DA530, is one of the rare SNRs observed at high Galactic latitudes. In Green’s SNR catalogue only 7 out of 256 Galactic SNRs have |b| > 6°. The other six SNRs are large-diameter nearby SNRs. G93.3+6.9 on the other hand, is a well-known example of a sub-energetic SNR. The SNR has a well-defined shell-like radio morphology and is extremely faint in X-rays (Landecker et al. 1999). X-ray spectral models indicate that the SN occurred in a low-density medium, consistent with a wind-blown bubble (Kaplan et al. 2004) typical of massive stars, indicating a cc-SN. From the further lack of enhanced iron lines, Jiang et al. (2007) argue that the SNR is likely the product of a core-collapse SN of an 8–12 M⊙ progenitor. A small-scale hard X-ray feature is detected near the centre of the remnant, which Jiang et al. (2007) hypothesize could be a PWN. They conclude that the stellar remnant must be a neutron star based on the subenergetic SN and the presence of a PWN. The Sedov blast model suggests a dynamical age for G93.3+6.9 of ∼5−7 kyr.
The angular diameter of 27′ × 20′ (Roger & Costain 1976) translates to a physical size of 17 × 13 pc at a distance of 2.2 ± 0.5 kpc (Foster & Routledge 2003).
Lorimer et al. (1998) carried out a radio-pulsar search using the 76 m Lovell radio-telescope at 606 MHz with an 8 MHz bandwidth. The remnant is larger than the telescope FoV, forcing observations to be split in multiple 34-min pointings. This set-up reached an estimated minimum flux density of Smin = 0.8 mJy. No pulsations were found. An X-ray study of the source by Kaplan et al. (2004) shows no signs of an associated compact X-ray source. Little is yet known about sub-energetic SNRs and the compact objects they produce.
2.6. G141.2+5.0
G141.2+5.0 is a newly found PWN (Kothes et al. 2014). It has a diameter of  , which at a distance of 4.0 kpc translates to a physical size of ∼4 pc. Kothes et al. (2014) also reveal a small H I bubble enclosing the PWN, which could be either the parent SNR or a progenitor-blown wind-bubble. G141.2+5.0 is the first SNR/PWN found in the Cygnus spiral arm and has a steep spectrum, which makes it part of a rare class of steep spectrum PWNe. In one of the other sources in this class, G76.9+1.1, the steep spectrum was not caused by the usual ageing, but a highly energetic, young pulsar was found to power it. This suggests a young nature also for our target. No age estimate is provided.
Recently, a compact X-ray source has been found at the centre of G141.2+5.0, confirming its PWN nature (Reynolds & Borkowski 2016). A search for X-ray pulsations was limited to a time resolution of 3.141 s. This resolution only allows for detection of periods beyond 12.5 s, which is slower than the rotation period for all known isolated neutron stars but one. A search for the putative pulsar with the Green Bank Telescope (GBT), encompassing the entire PWN, at 820 MHz, and with a 200 MHz bandwidth for 6000 s did not result in any detections (D. Lorimer, priv. comm.).
2.7. G150.3+4.5
This SNR was recently discovered by Gao & Han (2014) in the Urumqi λ6 cm Galactic plane survey data. G150.3+4.5 is an elliptical ( ) shell-type SNR with a typical steep radio synchrotron spectrum of α = −0.6. Part of the shell overlaps with SNR G149.5+3.2.
The 2FHL Fermi catalogue (Ackermann et al. 2016) reports on a high-energy counterpart to G150.3+4.5. 2FHL J04031.2+5553e is a hard-spectrum, extended source and is spatially coincident with G150.3+4.5. Ackermann et al. (2017) search for extended sources within 7° of the Galactic plane using 6 yr of Fermi-LAT data. The hard spectrum of G150.3+4.5 in the 10 GeV–2 TeV band is similar to that of young shell-type supernova remnants, but its large size and faintness suggest that it is old. Finding a young pulsar would hence be interesting. The age of the remnant remains inconclusive.
Since this source has only recently been identified as a SNR, no pulsar searches have been reported. The unknown distance cannot act as a criterion to exclude this source. As its location off the Galactic plane forecasts relatively low dispersion, we include it in our sample. For completeness we search out to a DM of 400, above which we expect difficulties in finding a signal at our low observing frequency. As this is twice the maximum DM expected for this entire line of sight (Cordes & Lazio 2002; Yao et al. 2017), the source dispersion measure falls within our search capabilities.
2.8. G189.1+3
G189.1+3 is better known as SNR IC 443, and it hosts PWN G189.22+2.90, discovered by Olbert et al. (2001) using Chandra and VLA observations. We refer to the entire object as G189.1+3. The nebula shows a cometary morphology and hosts an unresolved point source (CXOU J061705.3+222127) near its apex. This soft X-ray point source is probably the young pulsar powering the nebula and is well-observed. Gaensler et al. (2006) provide support for a physical association of the PWN and the SNR. Amongst others, they show that the thermal emission from CXOU J016705.3+222127 is consistent with standard cooling at the estimated age of 30 kyr (Chevalier 1999) for IC 443. This is further supported by the high spatial X-ray Chandra spectra of G189.22+2.90 obtained by Swartz et al. (2015), which are fit with a hydrogen atmosphere model. From the derived effective temperature and bolometric luminosity, similar temperature and luminosities were obtained in some neutron star cooling models for τ∼ 30 kyr. This is in agreement with previous research on the age of the remnants. A search for X-ray pulsations, restricted to periods longer than 6.5 s yielded no detection.
Early observations of the parent SNR, IC 443, suggest an age of ∼3 kyr (Petre et al. 1988). However, Chevalier (1999) obtain an age of 30 kyr for a physical size of 7.4 pc.
Ambrocio-Cruz et al. (2017) find a kinematic distance to the source of 1.9 kpc. This corresponds to a radius of the SNR of 10.5 pc. There the velocity of the filaments is explained by an age of the system, again of 30 kyr. Earlier work, however, assumes a distance of 1.5 kpc (Welsh & Sallmen 2003). In this work we adopt a distance of 1.5 kpc for consistency.
The X-ray structure of the PWN is discussed in great detail by Gaensler et al. (2006). Its diameter of  translates to a distance from the point source to the forward termination shock of 0.6 pc. The surface temperature measured by Gaensler et al. (2006) for the putative pulsar J0617+2221 is consistent with the age of 30 kyr, and given the consensus we adopt this age for the source.
The high-energy spectrum of the source and its flux are consistent with that of a rotation-powered pulsar (Swartz et al. 2015), but previous searches could not find a pulsar. Manchester et al. (1985) searched the remnant, including the later discovered point source, at 1.4 GHz down to a sensitivity of 1 mJy, and Kaspi et al. (1996) provide upper limits of 1.5 mJy at 436 MHz and 0.4 mJy at 1520 MHz, where at least one of these observations covered the entire remnant and the other focused at its centre.
3. Observations and data reduction
3.1. Observations
We targeted our observations to cover the above-mentioned sources in their entirety, unless a PWN or point source had been confirmed. In those cases we only observed the PWN or point source. The observations were obtained using the high-band antennas (HBA) operating in the 110−188 MHz range (project code LC3_024). We used the Core stations, which make up the inner 2 km radius of LOFAR. Up to 24 of these are available. As they operate on the same clock signal, their data can be immediately formed via tied-array beams (TABs; Stappers et al. 2011). For each observation we tiled out the area source using TABs. As each source differs in size (see Table 1), the observational set-up per source is customized. We specified each observation such that the entire area of the source would be covered while ensuring a maximum possible sensitivity. This entails maximizing the allowable data-rate, and for the biggest sources only observing with the Superterp (inner 6) stations which produces a larger beam size. The resulting beam patterns, including an occasional missing beam for G49.2−0.7 and G93.3+6.9, are detailed in Table 2 and shown in Fig. 1.
Target parameters.
Observational set-up for each of our targets.
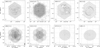 |
Fig. 1. Beam pattern for the eight observations, ordered from largest diameter (top left panel) to smallest (bottom right panel). Observations in the top row all employ 91 tied array beams. In the bottom row, patterns contain either 7 beams (left panel) or 1 beam (right panel). The general beam numbering pattern is visible in the top left panel. For the respective sources, the background contours (grey) and observation bounding boxes (light grey) are derived from: G65.3+5.7: ROSAT 0.44−1.21 keV (Shelton et al. 2004). The position of pulsar J1931+30 is indicated by a black circle; G150.3+4.5: Effelsberg 1.4 GHz (Gao & Han 2014); G49.2−0.7: VLA 1.4 GHz (Koo et al. 2005); G93.3+6.9: DRAO Synthesis Telescope 1.4 GHz (Landecker et al. 1999); G63.7+1.1: Westerbork Synthesis Radio Telescope (WSRT) 1.4 GHz (Wallace et al. 1997) in grey; X-ray nebula (Matheson et al. 2016) in black; G141.2+5.0: WSRT 327 MHz (Kothes et al. 2014). Here our candidate-confirmation pointing is marked with a dashed ellipse; G74.9+1.2: VLA 1.4 GHz (Liu et al. 2018). The X-ray nebula identified by Matheson et al. (2013) is marked with a cross; G189.1+3.0: VLA 8.5 GHz (Gaensler et al. 2006). |
For each source we recorded 3 h of Stokes I data with 32 channels per sub-band at 8 bits per sample and a time resolution of 1.3 ms. This time resolution is sufficient to detect young pulsars which are expected to have periods in the 10−100 ms range. Additionally, the resulting channel widths of 6.1035 kHz allow for little loss in sensitivity when reducing the data at higher DMs (see Sect. 3.2). To verify the system we recorded nearby pulsars that Pilia et al. (2016) had shown to be clearly visible, before each observation, using exactly the same search set-up. To maximize sensitivity allowed by the fixed LOFAR HBA tiles, all observations were scheduled around transit.
3.2. Data reduction
After each observation the data were pre-processed by the LOFAR pulsar pipeline (Alexov et al. 2010; Stappers et al. 2011) and saved in PSRFITS format (Hotan et al. 2004) on the LOFAR Long-Term Archive3. These 30 TB of data were transferred using GridFTP to the Dutch national supercomputer Cartesius4.
We further reduced the data using PRESTO5 (Ransom 2001). The data were cleaned from radio frequency interference (RFI) and searched for periodic and single pulses. To reduce the computational cost, we limited the dispersion search range of each source based on the DM predicted by the Cordes & Lazio (2002) and Yao et al. (2017) electron density models (see Table 3). The data were de-dispersed in steps of 0.01 pc cm−3 up to a DM of 300 pc cm−3 and then in steps of 0.03 pc cm−3.
Expected DM upper limit on the mean flux density Smin, and maximum possible pseudo-luminosity Lmax for each of the sources.
We inspected all candidates down to a PRESTO-reported σ = 4, equal to a χ2 of 1.8. This resulted in ∼450 candidates per beam, totalling a staggering 150 000 candidates. For each source we were able to blindly find the observed test-pulsar and/or a side-lobe pulsar which verified our observational set-up.
For the single pulse search we used the sifting algorithm developed by Michilli et al. (2018). All candidates with σ > 8 were inspected.
4. Results
4.1. Pulsar candidate towards G141.2+5.0
We detected a very interesting candidate in the central G141.2+5.0 pointing, shown in Fig. 2, hereafter referred to as J0337+62. Its position in the central beam is consistent with the position of the central X-ray point source (Reynolds & Borkowski 2016). Its 94 ms period is as expected for a young pulsar. The PRESTO pipeline ranked it as σ = 6, and reports that the pulse profile deviates from a straight line at the χ2 = 2.5 level. This significance inspires confidence: new LOFAR pulsars have been discovered with lower (less significant) values for χ2. The second LOFAR pulsar found, J0613+3731 (Coenen et al. 2014), was discovered at χ2 = 2.4 (Fig. 4.8 in Coenen 2013). Of the 83 pulsars discovered with LOFAR since6, 11 have χ2 ≤ 2.4; the detections are as dim as illustrated by PSR J1342+65 at χ2 = 1.7 and σ = 4.2.
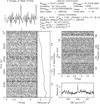 |
Fig. 2. Candidate detection toward G141.2+5.0. The signal is broadband and present throughout the entire 3-hour observation. The DM is 226 pc cm−3, consistent with the expected distance and contribution of the nebula itself. Its period of 94.13 ms is compatible with a young pulsar. |
The DM of J0337+62, 226 pc cm−3, is consistent with the expected DM plus a contribution from the nebula itself. At the proposed distance of 4.0 ± 0.5 kpc on this line of sight, the dispersion measure from the ISM predicted by the NE2001 model would amount to  pc cm−3 (see Table 3). This implies that the direct environment contributes ∼40% of the DM. Although high, this is not unusual. PSR J0908−4913 resides in a high density PWN (>2 pc cm−3, see Gaensler et al. 1998) and is observed through the Gum nebula, which together could contribute 100 pc cm−3 to the total DM (Cordes et al. 2016). If confirmed, pulsar J0337+62 would have the highest DM discovered by or otherwise seen with LOFAR (Bilous et al. 2016).
Even after de-dispersion the observed pulse should still contain the imprint of multi-path scatter broadening, if it is astrophysical. The observed pulse peak indicates a maximum scattering time (τs) of about 6 ms (Fig. 2). The scattering time derived by Kuzmin & Losovsky (2007) for regular pulsars at 100 MHz roughly scales with DM as  . However, as shown by Cordes et al. (2016), pulsars in PWNe can be severely under-scattered, or over-dispersed. For a PWN pulsar such as J0908−4913 the dispersion measure needs to be reduced by ∼130 pc cm−3 (almost 75%) to follow the DM–scattering relation from Cordes et al. (2016). In systems like J0908−4913, and probably in a number of the targets from the current work, the higher gas density intrinsic to the PWN increases the final DM, but not the scattering. Such local DM increases are also seen in the ensemble studies in Straal et al. (2018). Likewise, we can assume here that the scatter-inducing, interstellar DM to the source follows from NE2001 (Table 3, DM
 ), and the remaining DM is local to the source, where it has little effect on the scatter broadening. If we determine the expected scattering following Kuzmin & Losovsky (2007) using the lower bound ISM contribution to the DM of 106 pc cm−3 and if we scale τs to 150 MHz as ν−4.4, the scatter broadening should be about 11 ms. This is slightly higher than the observed width pulse, but within the order-of-magnitude scatter around the relation visible in Fig. 3 of Kuzmin & Losovsky (2007).
Even for this high DM, low scatter broadening, and modest signal-to-noise ratio (S/N), the broadband nature of the signal, visible in Fig. 2, plus the fact that the period, period derivative, and dispersion measure are within the expected range for a young pulsar, drove us to classify this candidate as interesting for follow-up, as described in Sect. 5. The initial observation of G141.2+5.0 used seven TABs in total that overlap at 0.5 × FWHM. We folded the other six beams on the given period and DM, but no signal was seen. Given the low S/N of the candidate in the central beam, this non-detection is consistent with a radio signal from the central X-ray point source as this signal would be further attenuated in these outer beams, To verify that the signal was not an instrumental artefact we performed a search for periodic signals at a DM of 226.00 pc cm−3. No candidates of interest were found.
In other observations, no candidates were detected. For these we derive upper limits (see Sect. 4.2).
4.2. Derived upper limit of PSR J1931+30
The line of sight to SNR G65.3+5.7 harbours the pulsar J1931+30 (Camilo et al. 1996). In our observation it is located at the intersection (and FWHM) of beams 15 and 16 (see Fig. 1). We did not find this pulsar in our blind search. Searching beams 15 and 16 more thoroughly and assuming a spin-down rate between 10−11 and 10−14 s s−1 at its DM of 56 ± 5 pc cm−3 also did not yield any detection of this source, resulting in an upper limit at 150 MHz of 6 ± 3 mJy (see Sect. 4.3). That agrees with a spectral index of α = −1.4 or shallower.
4.3. Sensitivity limits
4.3.1. Sky background
The sky temperature Tsky is the dominant contributor to the LOFAR HBA system temperature Tsys. Generally this sky background consists mostly of the diffuse synchrotron emission from our Galaxy. In any survey for pulsars in supernova remnants, care needs to be taken to include the nebular emission. This is a significant effect, for example in Crab pulsar observations with LOFAR (Bilous et al. 2016; van Leeuwen et al., in prep.). Our general sky noise map is scaled from the Haslam et al. (1982) 408 MHz map. Remnants G65.3+5.7 and G150.3+4.5 are larger than the beam sizes used in this survey, and are resolved. Similarly, G49.2−0.7 and G93.3+6.9 are of comparable size to the map resolution. The noise effect of these four SNRs is thus included in the Haslam map and, in turn, in our pulsar search sensitivity estimates. For the other, smaller remnants we add an extra sky temperature component. To be conservative we base this on the addition that G63.7+1.1, the largest of the remaining four, makes to the background. Wallace et al. (1997) showed that the spectrum of G63.7+1.1 is quite flat, and from their 327 MHz measurement of 1.5 Jy, scaling as ν−0.3 (very similar to the −0.27 power law seen in the Crab nebula; Bietenholz et al. 1997) we estimate the 150 MHz SNR flux to be 1.9 ± 0.2 Jy. In our observations, however, the integrated flux density is divided over seven beams. This adds 0.3 Jy to the time-domain background, equivalent to about 1 K. This is not a significant addition to our system noise of 104 K, but for completeness we have included it in our sensitivity estimates below.
4.3.2. Sensitivity estimates
We base our upper limits on the peak S/N of candidate J0337+62. If the pulsar beam is so narrow that the profile is a single bin, then peak and integrated S/N are identical. We quote the peak S/N as the profile broadness is unknown in a blind search. The peak S/N for the profile shown in Fig. 2 top left is 4 (the integrated profile S/N is 10) and corresponds to an integrated-profile flux-density of 7.6 ± 3.8 mJy. Based on this peak S/N, we report 4× noise-rms flux-density, σrms, as our upper limit for the mean flux-density of the other sources. By necessity this is a very one-dimensional metric. Traits such as the signal consistency throughout the observation, and signal visibility over the entire bandwidth are not contained in it, but are important during human inspection. The sensitivity limits can be found in Table 3.
We obtain σRMS following the procedure7 described in Kondratiev et al. (2016). It derived the telescope noise levels from the radiometer equation for the exact observations parameters such as zenith angle, and the effective area of each individual station included.
In Table 3 we report the sensitivity limits for the coordinates of the central beam of each observation. The LOFAR sensitivity in a given observation depends strongly on elevation, and its influence on the effective area. This is visible from the source declination and beam size in Table 1 and our reported Smin in Table 3. This dependence, plus the fact that only 20 out of 23 core stations were available during the observation of G49.2−0.7, results in a poorer sensitivity for that observation. For completeness we check the gradient of this sensitivity fall-off with elevation over our more extended objects. Even in the largest source the sensitivity variation is within 3% of central beam. Finally, the reduced sensitivity towards G65.3+5.7 and G150.3+4.5 is a result of the trade-off between sensitivity and field of view, to maximize survey speed. For these large sources using only the Superterp (inner 6) stations with their large tied-array beams, provided the best sensitivity over the entire remnant within the allocated observing time.
5. Confirmation observing and data reduction
Under LOFAR Directors Discretionary Time (code: DDT6_001), our first attempt to confirm candidate J0337+62 was scheduled on 2016 June 13 when we re-observed the central beam of G141.2+5.0 (see Fig. 1). Data from 23 core stations were coherently beam formed. The increased observation duration of 5h15m improved our sensitivity by 33% over the limits sets in search mode (0.6 mJy vs. 0.8 mJy, see Sect. 6). We performed a search over the parameter space spanned by the unknown spin-down. In this search we also accounted for a change in DM of ±20 pc cm−3 due to potential filamentary structure in the PWN; however, the pulsar was not detected.
On 2017 January 8, in our second confirmation attempt, we combined the same stations. For 6 h we recorded the beam-formed data in complex-voltage mode (cf. Stappers et al. 2011). We wrote these baseband data to disc such that we could coherently de-disperse the data offline. In the initial detection, the apparent pulse width w ≃ 6 ms (Fig. 2). Given the relatively high dispersion measure of the candidate, 226 pc cm−3, up to 3.3 ms of this could be instrumental broadening caused by intra-channel dispersion smearing. Coherent de-dispersion eliminates this factor. If we follow the LOFAR radiometer equation (Eq. (3) in van Leeuwen & Stappers 2010) for the pulse period P = 94 ms, initial pulse width w ≃ 6 ms and assumed follow-up width w ≃ 4 ms, the resulting more concentrated pulse translates to a 20% increased sensitivity (see Sect. 4.3.2). From the increased observation duration we also derive an Smin = 0.55 mJy, which is 40% more sensitive than the initial detection. When both are combined our overall sensitivity increased by as much as 50%.
On recording, the 78 MHz of 8-bit baseband data were split over 20 sub-bands. These six TB were stored from the Poznań Supercomputing and Networking Center branch of the LTA (from where they are publicly available) and transferred to Cartesius. There the data were coherently de-dispersed within each sub-band using CDMT8 (Bassa et al. 2017). Sub-bands were combined to coherently de-disperse filterbank files containing 3200 channels at 164 μs sampling. After removing radio frequency interference, candidates were next folded over a range around their best frequencies, and blindly searched over a wider set of frequencies. No pulsar signals were seen. With the same set-up, test pulsar J0218+4232 was easily detected at its DM and period.
In summary, we were unable to confirm candidate J0337+62.
6. Discussion
6.1. Candidate pulsar J0337+62 in G141.2+5.0
Due to the modest significance of candidate J0337+62 we cannot rule out that non-Guassian noise processes (from RFI or instrumental) played a role in fortuitously mimicking a pulsar-like signal. And the large number of trials in our search gives ample opportunity for such a chance event.
Even so, a dozen other LOFAR pulsars this weak or weaker have been successfully confirmed. What could have caused the initial detection, and the later confirmation failures?
6.1.1. Scintillation
Pulsar signals are prone to several propagation effects caused by the ionized interstellar medium (IISM). Temporal variations of the dispersive delay and interstellar scattering observed in other pulsars are insufficient to weaken the candidate signal on a one-year timescale (Petroff et al. 2013; Hemberger & Stinebring 2008). However, G141.2+5.0 is identified as a PWN (Reynolds & Borkowski 2016) and PWNe are known to be highly turbulent media and show filamentary structure. The line-of-sight medium could have changed between our observing epochs, enhancing the scattering properties and causing the already weak signal to be below our detection threshold.
A propagation effect which is known to vary on several timescales is scintillation. In the observed frequency range the IISM causes propagation in the strong regime where the scintillation can be subdivided in refractive and diffractive scintillation. Diffractive interstellar scintillation (DISS) causes intensity variations in both time and frequency. The decorrelation bandwidth can be approached by Eq. (1) (Cordes et al. 1985):
 (1)
(1)
For G141.2+5.0 the decorrelation bandwidth of 0.123 kHz is smaller than the used channel width (6.1 kHz), ruling out diffractive scintillation. However, refractive scintillation (RISS) operates on longer timescales (e.g. months to years) and allows for a change in observed pulse intensity as demonstrated by Stinebring et al. (2000). One of the possible reasons we do not re-detect the initial pulse signal can be that RISS decreases the flux density to below our observing thresholds. In that case, the 14 months between the initial detection and first confirmation attempt must be the appropriate RISS timescale. Confirmation observations spaced with a similar yearly cadence can test this hypothesis.
6.1.2. Plasma lensing
The overlap with the low rate of re-detections in Fast Radio Bursts is also noteworthy. These sources too, at least some of them, are thought to reside in supernova remnants (Straal et al. 2018). Plasma lensing in that host environment may sometimes boost the signal strength. At those times the FRB is detected, yet follow-up observations of even the most high-significance FRBs has been fruitless (Petroff et al. 2015). Potentially the same effect is seen, much more nearby, in candidate J0337+62.
6.1.3. Intermittency
Among the handful of currently known intermittent pulsars (Lyne et al. 2017), some show ON fractions as low as 0.8%. Since most research on intermittent pulsars is performed at higher frequencies (e.g. 1 GHz), discovering a low-frequency intermittent pulsar would certainly be of interest. Furthermore, while the characteristic age of the five known intermittent pulsars is below the median age of the entire population, none of them is younger than 105 yr. Finding a young pulsar with intermittent behaviour could potentially shed further light on the magnetospheric circumstances conducive to such mode switching, as the short period creates different voltage gaps and currents. Given our continued confidence in the initial detection, intermittent behaviour is an option; however, confirming such an intrinsically variable source is challenging.
6.1.4. Future confirmation options
In three LOFAR observations of increasing sensitivity, candidate J0337+62 was only seen in the first session. It was not blindly detected at 820 MHz with GBT; and as data from that session was not archived, it could not be refolded specifically at the candidate period. Now that the DM is known, coherent de-dispersion can be applied in confirmation observations; and the observed scatter broadening is low (see Sect. 3.2). These two factors mitigate the major disadvantages of low-frequency searching. At 150 MHz, a 2019 repeat observation using LOFAR could confirm the source if scintillation has since amplified it. At 350 MHz, a deep observation with the GBT could potentially be constraining. For a spectral index α = −1.4, a 2 h integration can reach a limit about 2× deeper than reported here (comparing e.g. Coenen et al. 2011 to Table 3). At much higher energy, the detection of the 94 ms periodic signal in the X-rays emitted by the known image point source would confirm the candidate. Assuming a 50% pulse fraction, XMM-Newton timing mode observations are capable of this measurement in 25 ks, but no observations have been carried out to date.
6.2. Upper limits of non-detections
In Fig. 3 we compare the sensitivities obtained in our searches to previous surveys, conducted at higher frequencies, often covering only a fraction of the central remnant area. To properly compare our sensitivities we take into account the average pulsar flux-density spectral slope of α = −1.4 (see Sect. 1). After applying this scaling, our limits on one source, G74.9+1.2, are roughly of equal sensitivity to those of previous searches. Scaling the 430 MHz observation results in an expected flux density at 150 MHz of 1.9 mJy; a value of 1.6 mJy was obtained in this work. For all other sources searched before (G49.2−0.7, G65.3+5.7, G93.3+6.9, and G189.1+3), we obtain full coverage while also obtaining improved limits by as much as a factor of 10 (G189.1+3). In addition, for sources on which our searches are the first, we obtain very stringent sensitivity limits.
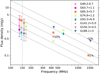 |
Fig. 3. Our sensitivity limits (left, at 150 MHz) compared to applicable earlier work. For previous searches that did not cover the entire supernova remnant size, the searched fraction is indicated. Per frequency only the most sensitive limits obtained are shown. A grid is overlaid with spectral slope α = −1.4 to indicate the scaling of our sensitivity limits (Bates et al. 2013). For visibility our limits are plotted slightly offset from the 150 MHz observing frequency (dashed line). |
However, except for G141.2+5.0, as discussed above, we do not find any candidates in the other observations. There can be multiple reasons for these non-detections, which we discuss below. We order them starting from the most basic and pulsar centric, its formation, all the way to the hurdles for the final detection of its signal by beaming and propagation effects.
6.2.1. Neutron star vs. black hole formation
It is possible that instead of a pulsar, a non-emitting neutron star or even a black hole is formed. Some radio-quiet neutron stars are observable as CCOs in the high-energy band, as mentioned in the introduction. The detection of an X-ray point source in G74.9+1.2 and G189.1+3 are indications that, at least there, a neutron star is formed. Both of these sources have a PWN, indicating the presence of an active rotation-powered pulsar instead of a CCO. The two SNRs that do not host a PWN (see Table 1) may have formed a CCO. Our stringent upper limits then argue in favour of CCOs as a radio-quiet class.
However, for the five sources without a confirmed point source, it is possible that the star collapsed to a black hole. As mentioned in Sect. 1, it is expected that between 13% and 25% of the cc-SNe produce black holes (Heger et al. 2003). Of the 383 SNRs reported in the online SNR catalogue (June 2018), we can expect that 75% are the result of a cc-SN (Cappellaro et al. 1999). Of these 287 SNRs, 170 have a (possible) NS, pulsar, or PWN association. This is 60% of the cc-SNRs. For simplification we assume that a PWN implies the presence of a pulsar. So in two-thirds of the remaining SNRs it is possible that a black hole is formed. Previous research argues that SNR G93.3+6.9 is the result of a sub-energetic SN and has likely formed a NS (Jiang et al. 2007). The other three sources in our sample, without associated PWN, could very well harbour a black hole rather than a pulsar.
6.2.2. Transversal velocity
In the SN explosion, pulsars receive a natal kick allowing them to travel away from their birth site. For those sources without an X-ray point source this could mean that the pulsar has travelled away from the centre, or even out of the remnant. As we searched the full area of each remnant without a point source, travelling out of the centre is insufficient to explain the non-detection. Here, the pulsar must have completely left the remnant. Using the parameters on SNR size and age provided in Sect. 2, we find that this requires transversal velocities exceeding 750 km s−1. The mean transversal velocity for single radio pulsars preferred by Faucher-Giguère & Kaspi (2006), of  km s−1, translates to a 3D velocity of
  km s−1. This is well below the velocity required for escaping the remnants.
Such high space velocities would produce bow shocks, which are not observed. We therefore conclude that the pulsars are still contained in their parent environment, and covered by our beam layout.
6.2.3. Beaming fraction
A necessary and important condition for being able to detect even the brightest pulsar is that its radio beam sweeps over us. The part of the sky, as seen from the frame of the pulsar, that the radio beam covers, defines the beaming fraction. This fraction thus also describes the chance the source is visible from Earth. The directly measurable decreasing pulse width for longer-period, older pulsars already suggests a trend from large beaming fractions for young pulsars to small fractions late in life (Lyne & Manchester 1988). The recently discovered, old, 24 s pulsar J0250+5854 displays a duty cycle of only 0.3% (Tan et al. 2018). The evidence is not just anecdotal; when looking at the entire pulsar population, the dearth of older pulsars also means their beaming fractions decrease until few are visible (van Leeuwen & Verbunt 2004). Young pulsars in this population, however, must have high beaming fractions.
Young pulsars do not regularly show the broad profiles one would expect for circular beams with high beaming fractions. A different noteworthy characteristic of their profiles is, however, an overabundance of interpulses. These already suggest that the radio beams in young pulsars are elongated in latitude. The first hints seen in a relatively small sample of polarization measurements by Narayan & Vivekanand (1983) were recently confirmed in PSR J1906+0746, where geodetic precession, caused by the binary interaction with its companion (van Leeuwen et al. 2015), allowed mapping of the main and interpulse components; and indeed significant elongation is observed (Desvignes et al. 2013).
Studies of beaming fractions were often complicated by our inability to determine the “ground truth”, what the actual count of emitting sources is compared to the number we see. Beaming fractions could be derived by starting from known SNRs and determining how many pulsars were detected (cf. Kaspi 2000), but including any such results here would circularize our reasoning. The central source of a PWN is beyond question, so these can be confidently used as ground truth. From a study of such nebulae, Frail & Moffett (1993) find a beaming fraction of 0.6 ± 0.1. More recently, the increasing number of γ-ray detected pulsars offers a new angle of analysis. In a study comparing the γ-ray and radio detection probabilities of young pulsars, Ravi et al. (2010) find the radio beaming fraction of young, energetic pulsars is >0.6, and most likely approaches unity.
Given an unbiased sample of pulsars in SNRs, the beaming fraction of young pulsars is thus high enough to confidently rule this out as the cause for non-detections in all surveyed sources. However, part of the eight SNRs in this study were chosen because no pulsars had been detected yet; if we look at the total population of ∼60 SNR pulsars, with a beaming fraction of 0.9 it is possible that the eight in our study are the subset whose beams miss us.
6.2.4. Luminosity
Given the known luminosities of young pulsars, could these sources be beamed at us, but are too dim to detect? We first compare our set to the Crab pulsar. The target farthest from Earth is G74.9+1.2 at 6.1 ± 0.9 kpc. Moving, for the sake of argument, the Crab pulsar from its current distance of 2 kpc would decrease the flux density by an order of magnitude, yet within an hour LOFAR observes multiple Crab giant pulses with S/N values of several hundred (van Leeuwen et al., in prep.). These would thus easily be detectable for all SNRs in our set. The periodic signal of the Crab, with its mean flux density of 8 ± 4 Jy at LOFAR frequencies (Bilous et al. 2016), would also be far above our sensitivity limits as listed in Table 3, even after being diluted by a maximum factor of 10 by the inverse square law.
We next aim to compare our limits to the luminosity of the ensemble of known young pulsars. For this we use the pseudo-luminosities Lmax = Smin × d2 presented in Table 3. However, of the 81 pulsars in the ATNF catalogue9 (Manchester et al. 2005) having a pulse period P less than 100 ms and a characteristic age τ below 100 kyr, just 13 have a 400 MHz flux density measurement. Only from these values can a somewhat dependable 150 MHz flux density be estimated. The other 68 have reported fluxes only at 1.4 GHz and higher. Extrapolating those down over an order of magnitude in frequency would introduce much uncertainty, given the variations in spectral index.
For these 13 objects, pseudo-luminosities at 150 MHz are expected to be in the range of ∼10−104 mJy kpc2. For our observation with the least stringent Lmax limit of 90 mJy kpc2, toward G49.2−0.7, one-half of these 13 objects would have been detected. In our observations of G74.9+1.2 and G63.7+1.1, two-thirds of the sample would be found. In all other observations, each of the existing pulsars would have been detected, save for an occasional miss on the very dim source PSR J0659+1414 (Weltevrede et al. 2010), which is only 9 mJy kpc2.
The uncertainty introduced by scaling 400 MHz fluxes down to 150 MHz could be avoided by using only the LOFAR fluxes reported in Bilous et al. (2016). Among these only two young pulsars (P < 100 ms and τ < 100 kyr; or associated with a SNR) are found, PSR B0531+21 and PSR B0656+14. Even so, a statistical comparison by means of a Kolmogorov–Smirnov test indicates that the 150 MHz pseudo-luminosities from the entire Bilous et al. (2016) sample of 152 pulsars are indistinguishable from those extrapolated for the set of 13 young ATNF pulsars. The spectral index uncertainty thus does not play a significant role on our completeness estimate.
Given the known pulsar luminosities, we conclude that our searches were sensitive and deep enough for all targets save perhaps, by chance, one.
6.2.5. Propagation effects
It could be that a pulsar is formed that resides in the remnant and is beamed towards us, and bright enough in principle, but still undetectable due to pulse broadening, for example. As the impulsive signal travels through the IISM it gets smeared out in time by dispersion and scattering. The dispersion of the signal scales with ν−2 and is therefore stronger at lower frequencies. This limits the DM range we are able to search. Signals with a very high DM would be too broadened for us to detect. At our observing frequency, overly high DMs cause intra-channel dispersion smearing which reduces our S/N (see the discussion on the confirmation observations presented in Sect. 5). In our observational set-up this effect becomes noticeable above DMs of 100 pc cm−3.
Our source selection criteria aimed to limit the expected DMs, based on the distance information from the literature. Potentially, some of these distances and DMs were underestimated. For individual sources the NE2001 model can be off by a factor of 1.5−2 (Schnitzeler 2012). Additionally, in Straal et al. (2018) we show that pulsars in SNRs and PWNe generally exhibit DMs that are 20 pc cm−3 higher than the model predicts.
A further propagation effect that strongly affects the low-frequency signal is scattering. Scattering scales with ν−4.4 for a Kolmogorov turbulent medium and is therefore more prevalent at lower frequencies. The multi-path propagation of the signal causes pulse smearing for which we cannot correct in the data reduction.
Although we have taken pre-cautions in our source selection, both propagation effects can strongly affect the signal strength, and could explain the non-detections. Higher frequency observations suffer from these deleterious effects less, but on these extended sources that advantage is generally offset by the smaller field of view of the telescopes that offer such frequencies.
7. Conclusions
We have performed the first low-frequency directed pulsar search towards eight selected SNRs and PWNe. Some of these had previously been searched at higher frequencies. We find one very interesting pulsar candidate, J0337+62, towards G141.2+5.0 at the position of the X-ray point source, with a period of 94.13 ms and at a DM of 226 pc cm−3. We re-observed the source twice, with a 30% and 50% increased sensitivity, but were unable to confirm the candidate. Its low detection S/N of 4 could mean our fortuitous initial detection and subsequent non-detections in the follow-up were due to enhanced scattering or refractive scintillation.
One non-associated pulsar in the line of sight to G65.3+5.7, PSR J1931+30, was located at the edge of two of our observing beams, and was not detected. Our upper limit of 6 ± 3 mJy at 150 MHz, agrees with a spectral index of α = −1.4 or shallower.
For all sources we obtain improved sensitivity limits and we discuss the reasons of the non-detections.
Two unique aspects of this SNR/PWN pulsar search, the largest such low-frequency survey to date, are the wide field and the high sensitivity. These allow us to conclude the following. First, from our wide field we determine that the putative pulsars cannot have left their remnants. Second, from our high sensitivity we infer that some of these SNRs do not host a neutron star, but a black hole, and that the remainder are invisible due to propagation and beaming effects.
Online SNR catalogue; http://www.physics.umanitoba.ca/snr/SNRcat
Green’s SNR catalogue; http://www.mrao.cam.ac.uk/surveys/snrs/
LTA; https://lta.lofar.eu
Implemented in python as https://github.com/vkond/LOFAR-BF-pulsar-scripts/blob/master/fluxcal/lofar_fluxcal.py
Acknowledgments
The research leading to these results has received funding from the European Research Council under the European Union’s Seventh Framework Programme (FP/2007–2013)/ERC Grant Agreement n. 617199, and from the Netherlands Research School for Astronomy (NOVA4-ARTS). This work was carried out on the Dutch national e-infrastructure with the support of SURF Cooperative. Computing time was provided by NWO Physical Sciences (project 15236). We thank Terlouw & Vogelaar (2015) for developing the Kapteyn Package and Pitkin (2018) for psrqpy. This paper is based on data obtained with the International LOFAR Telescope (ILT) under project codes LC3_024, DDT6_001 and LC7_032. LOFAR (van Haarlem et al. 2013) is the Low Frequency Array designed and constructed by ASTRON. It has observing, data processing, and data storage facilities in several countries that are owned by various parties (each with its own funding sources), and that are collectively operated by the ILT foundation under a joint scientific policy. The ILT resources have benefited from the following recent major funding sources: CNRS-INSU, Observatoire de Paris, and Université d’Orléans, France; BMBF, MIWF-NRW, MPG, Germany; Science Foundation Ireland (SFI), Department of Business, Enterprise and Innovation (DBEI), Ireland; NWO, The Netherlands; The Science and Technology Facilities Council, UK; Ministry of Science and Higher Education, Poland.
References
- Ackermann, M., Ajello, M., Atwood, W. B., et al. 2016, ApJS, 222, 5 [NASA ADS] [CrossRef] [Google Scholar]
- Ackermann, M., Ajello, M., Baldini, L., et al. 2017, ApJ, 843, 139 [NASA ADS] [CrossRef] [Google Scholar]
- Alexov, A., Hessels, J., Mol, J. D., Stappers, B., & van Leeuwen, J. 2010, in Astronomical Data Analysis Software and Systems XIX, eds. Y. Mizumoto, K. I. Morita, & M. Ohishi, ASP Conf. Ser., 434, 193 [NASA ADS] [Google Scholar]
- Ambrocio-Cruz, P., Rosado, M., de la Fuente, E., Silva, R., & Blanco-Piñon, A. 2017, MNRAS, 472, 51 [NASA ADS] [CrossRef] [Google Scholar]
- Bassa, C. G., Pleunis, Z., & Hessels, J. W. T. 2017, Astron. Comput., 18, 40 [NASA ADS] [CrossRef] [Google Scholar]
- Bates, S. D., Lorimer, D. R., & Verbiest, J. P. W. 2013, MNRAS, 431, 1352 [NASA ADS] [CrossRef] [Google Scholar]
- Bietenholz, M. F., Kassim, N., Frail, D. A., et al. 1997, ApJ, 490, 291 [NASA ADS] [CrossRef] [Google Scholar]
- Biggs, J. D., & Lyne, A. G. 1996, MNRAS, 282, 691 [NASA ADS] [CrossRef] [Google Scholar]
- Bilous, A. V., Kondratiev, V. I., Kramer, M., et al. 2016, A&A, 591, A134 [NASA ADS] [CrossRef] [EDP Sciences] [Google Scholar]
- Camilo, F., Nice, D. J., Shrauner, J. A., & Taylor, J. H. 1996, ApJ, 469, 819 [NASA ADS] [CrossRef] [Google Scholar]
- Cappellaro, E., Evans, R., & Turatto, M. 1999, A&A, 351, 459 [NASA ADS] [Google Scholar]
- Chevalier, R. A. 1999, ApJ, 511, 798 [NASA ADS] [CrossRef] [Google Scholar]
- Coenen, T. 2013, PhD Thesis, University of Amsterdam [Google Scholar]
- Coenen, T., van Leeuwen, J., & Stairs, I. H. 2011, A&A, 531, A125 [NASA ADS] [CrossRef] [EDP Sciences] [Google Scholar]
- Coenen, T., van Leeuwen, J., Hessels, J. W. T., et al. 2014, A&A, 570, A60 [NASA ADS] [CrossRef] [EDP Sciences] [Google Scholar]
- Cooper, S. 2017, PhD Thesis, The University of Manchester [Google Scholar]
- Copetti, M. V. F., & Schmidt, A. A. 1991, MNRAS, 250, 127 [NASA ADS] [Google Scholar]
- Cordes, J. M., & Lazio, T. J. W. 2002, ArXiv e-prints [arXiv:astro-ph/0207156] [Google Scholar]
- Cordes, J. M., Weisberg, J. M., & Boriakoff, V. 1985, ApJ, 288, 221 [NASA ADS] [CrossRef] [Google Scholar]
- Cordes, J. M., Wharton, R. S., Spitler, L. G., Chatterjee, S., & Wasserman, I. 2016, ArXiv e-prints [arXiv:1605.05890] [Google Scholar]
- De Luca, A. 2017, J. Phys. Conf. Ser., 932, 012006 [CrossRef] [Google Scholar]
- Desvignes, G., Kramer, M., Cognard, I., et al. 2013, IAU Symp., 291, 199 [NASA ADS] [Google Scholar]
- Faucher-Giguère, C.-A., & Kaspi, V. M. 2006, ApJ, 643, 332 [NASA ADS] [CrossRef] [Google Scholar]
- Ferrand, G., & Safi-Harb, S. 2012, AdSpR, 49, 1313 [Google Scholar]
- Foster, T., & Routledge, D. 2003, ApJ, 598, 1005 [NASA ADS] [CrossRef] [Google Scholar]
- Frail, D. A., & Moffett, D. A. 1993, ApJ, 408, 637 [NASA ADS] [CrossRef] [Google Scholar]
- Gaensler, B. M., & Johnston, S. 1995, MNRAS, 275, L73 [NASA ADS] [CrossRef] [Google Scholar]
- Gaensler, B. M., Stappers, B. W., Frail, D. A., & Johnston, S. 1998, ApJ, 499, L69 [NASA ADS] [CrossRef] [Google Scholar]
- Gaensler, B. M., Chatterjee, S., Slane, P. O., et al. 2006, ApJ, 648, 1037 [NASA ADS] [CrossRef] [Google Scholar]
- Gao, X. Y., & Han, J. L. 2014, A&A, 567, A59 [NASA ADS] [CrossRef] [EDP Sciences] [Google Scholar]
- Gorham, P. W., Ray, P. S., Anderson, S. B., Kulkarni, S. R., & Prince, T. A. 1996, ApJ, 458, 257 [NASA ADS] [CrossRef] [Google Scholar]
- Green, D. A. 2009, Bull. Astron. Soc. India, 37, 45 [Google Scholar]
- Green, D. A. 2014, Bull. Astron. Soc. India, 42, 47 [NASA ADS] [Google Scholar]
- Green, D. A., & Gull, S. F. 1989, MNRAS, 237, 555 [NASA ADS] [CrossRef] [Google Scholar]
- Gull, T. R., Kirshner, R. P., & Parker, R. A. R. 1977, ApJ, 215, L69 [NASA ADS] [CrossRef] [Google Scholar]
- Haslam, C. G. T., Stoffel, H., Salter, C. J., & Wilson, W. E. 1982, A&AS, 47, 1 [NASA ADS] [Google Scholar]
- Heger, A., Fryer, C. L., Woosley, S. E., Langer, N., & Hartmann, D. H. 2003, ApJ, 591, 288 [NASA ADS] [CrossRef] [Google Scholar]
- Hemberger, D. A., & Stinebring, D. R. 2008, ApJ, 674, L37 [NASA ADS] [CrossRef] [Google Scholar]
- Hobbs, G., Lorimer, D. R., Lyne, A. G., & Kramer, M. 2005, MNRAS, 360, 974 [NASA ADS] [CrossRef] [Google Scholar]
- Hotan, A. W., van Straten, W., & Manchester, R. N. 2004, PASA, 21, 302 [NASA ADS] [CrossRef] [Google Scholar]
- Izvekova, V. A., Kuzmin, A. D., Malofeev, V. M., & Shitov, I. P. 1981, Ap&SS, 78, 45 [NASA ADS] [CrossRef] [Google Scholar]
- Jiang, B., Chen, Y., & Wang, Q. D. 2007, ApJ, 670, 1142 [NASA ADS] [CrossRef] [Google Scholar]
- Kaplan, D. L., Frail, D. A., Gaensler, B. M., et al. 2004, ApJS, 153, 269 [NASA ADS] [CrossRef] [Google Scholar]
- Kaplan, D. L., Gaensler, B. M., Kulkarni, S. R., & Slane, P. O. 2006, ApJS, 163, 344 [NASA ADS] [CrossRef] [Google Scholar]
- Kaspi, V. M. 2000, in IAU Colloq. 177: Pulsar Astronomy – 2000 and Beyond, eds. M. Kramer, N. Wex, & R. Wielebinski, ASP Conf. Ser., 202, 485 [NASA ADS] [Google Scholar]
- Kaspi, V. M., Manchester, R. N., Johnston, S., Lyne, A. G., & D’Amico, N. 1996, AJ, 111, 2028 [NASA ADS] [CrossRef] [Google Scholar]
- Keane, E. F., & Kramer, M. 2008, MNRAS, 391, 2009 [NASA ADS] [CrossRef] [Google Scholar]
- Kondratiev, V. I., Verbiest, J. P. W., Hessels, J. W. T., et al. 2016, A&A, 585, A128 [NASA ADS] [CrossRef] [EDP Sciences] [Google Scholar]
- Koo, B.-C., Kim, K.-T., & Seward, F. D. 1995, ApJ, 447, 211 [NASA ADS] [CrossRef] [Google Scholar]
- Koo, B.-C., Lee, J.-J., & Seward, F. D. 2002, AJ, 123, 1629 [NASA ADS] [CrossRef] [Google Scholar]
- Koo, B.-C., Lee, J.-J., Seward, F. D., & Moon, D.-S. 2005, ApJ, 633, 946 [NASA ADS] [CrossRef] [Google Scholar]
- Kothes, R., Reich, W., Foster, T., & Byun, D.-Y. 2003, ApJ, 588, 852 [NASA ADS] [CrossRef] [Google Scholar]
- Kothes, R., Sun, X. H., Reich, W., & Foster, T. J. 2014, ApJ, 784, L26 [NASA ADS] [CrossRef] [Google Scholar]
- Kuzmin, A. D., & Losovsky, B. Y. 2007, Astron. Astrophys. Trans., 26, 597 [NASA ADS] [CrossRef] [Google Scholar]
- Landecker, T. L., Routledge, D., Reynolds, S. P., et al. 1999, ApJ, 527, 866 [NASA ADS] [CrossRef] [Google Scholar]
- Liu, Q.-C., Chen, Y., Chen, B.-Q., et al. 2018, ApJ, 859, 173 [NASA ADS] [CrossRef] [Google Scholar]
- Lorimer, D. R., Yates, J. A., Lyne, A. G., & Gould, D. M. 1995, MNRAS, 273, 411 [NASA ADS] [CrossRef] [Google Scholar]
- Lorimer, D. R., Lyne, A. G., & Camilo, F. 1998, A&A, 331, 1002 [NASA ADS] [Google Scholar]
- Lozinskaya, T. A. 1981, Sov. Astron. Lett., 7, 17 [NASA ADS] [Google Scholar]
- Lyne, A. G., & Manchester, R. N. 1988, MNRAS, 234, 477 [NASA ADS] [CrossRef] [Google Scholar]
- Lyne, A. G., Stappers, B. W., Freire, P. C. C., et al. 2017, ApJ, 834, 72 [NASA ADS] [CrossRef] [Google Scholar]
- Malofeev, V. M., Malov, O. I., & Shchegoleva, N. V. 2000, Astron. Rep., 44, 436 [NASA ADS] [CrossRef] [Google Scholar]
- Manchester, R. N., Damico, N., & Tuohy, I. R. 1985, MNRAS, 212, 975 [NASA ADS] [CrossRef] [Google Scholar]
- Manchester, R. N., Hobbs, G. B., Teoh, A., & Hobbs, M. 2005, AJ, 129, 1993 [NASA ADS] [CrossRef] [Google Scholar]
- Maron, O., Kijak, J., Kramer, M., & Wielebinski, R. 2000, A&AS, 147, 195 [NASA ADS] [CrossRef] [EDP Sciences] [Google Scholar]
- Matheson, H., Safi-Harb, S., & Kothes, R. 2013, ApJ, 774, 33 [NASA ADS] [CrossRef] [Google Scholar]
- Matheson, H., Safi-Harb, S., & Kothes, R. 2016, ApJ, 825, 134 [NASA ADS] [CrossRef] [Google Scholar]
- Michilli, D., Hessels, J. W. T., Lyon, R. J., et al. 2018, MNRAS, 480, 3457 [NASA ADS] [CrossRef] [Google Scholar]
- Narayan, R., & Vivekanand, M. 1983, A&A, 122, 45 [NASA ADS] [Google Scholar]
- Olbert, C. M., Clearfield, C. R., Williams, N. E., Keohane, J. W., & Frail, D. A. 2001, ApJ, 554, L205 [NASA ADS] [CrossRef] [Google Scholar]
- Petre, R., Szymkowiak, A. E., Seward, F. D., & Willingale, R. 1988, ApJ, 335, 215 [NASA ADS] [CrossRef] [Google Scholar]
- Petroff, E., Keith, M. J., Johnston, S., van Straten, W., & Shannon, R. M. 2013, MNRAS, 435, 1610 [NASA ADS] [CrossRef] [Google Scholar]
- Petroff, E., Johnston, S., Keane, E. F., et al. 2015, MNRAS, 454, 457 [NASA ADS] [CrossRef] [Google Scholar]
- Pilia, M., Hessels, J. W. T., Stappers, B. W., et al. 2016, A&A, 586, A92 [NASA ADS] [CrossRef] [EDP Sciences] [Google Scholar]
- Pitkin, M. 2018, J. Open Source Soft., 3, 538 [Google Scholar]
- Ranasinghe, S., & Leahy, D. A. 2018, AJ, 155, 204 [NASA ADS] [CrossRef] [Google Scholar]
- Ransom, S. M. 2001, PhD Thesis, Harvard University [Google Scholar]
- Ravi, V., Manchester, R. N., & Hobbs, G. 2010, ApJ, 716, L85 [NASA ADS] [CrossRef] [Google Scholar]
- Reich, W., Berkhuijsen, E. M., & Sofue, Y. 1979, A&A, 72, 270 [NASA ADS] [Google Scholar]
- Reynolds, S. P., & Borkowski, K. J. 2016, ApJ, 816, L27 [NASA ADS] [CrossRef] [Google Scholar]
- Roberts, M. S. E. 2004, The Pulsar Wind Nebula Catalog (March 2005 Version) [Google Scholar]
- Roger, R. S., & Costain, C. H. 1976, A&A, 51, 151 [NASA ADS] [Google Scholar]
- Schaudel, D., Becker, W., Lu, F., & Aschenbach, B. 2002, in 34th COSPAR Scientific Assembly, COSPAR Meeting, 34, 2563 [Google Scholar]
- Schnitzeler, D. H. F. M. 2012, MNRAS, 427, 664 [NASA ADS] [CrossRef] [Google Scholar]
- Shelton, R. L., Kuntz, K. D., & Petre, R. 2004, ApJ, 615, 275 [NASA ADS] [CrossRef] [Google Scholar]
- Stappers, B. W., Hessels, J. W. T., Alexov, A., et al. 2011, A&A, 530, A80 [NASA ADS] [CrossRef] [EDP Sciences] [Google Scholar]
- Stinebring, D. R., Smirnova, T. V., Hankins, T. H., et al. 2000, ApJ, 539, 300 [NASA ADS] [CrossRef] [Google Scholar]
- Straal, S. M., Connor, L., & van Leeuwen, J. 2018, A&A, submitted [arXiv: 1902.00356] [Google Scholar]
- Swartz, D. A., Pavlov, G. G., Clarke, T., et al. 2015, ApJ, 808, 84 [NASA ADS] [CrossRef] [Google Scholar]
- Tan, C. M., Bassa, C. G., Cooper, S., Dijkema, T. J., & van Leeuwen, J. 2018, A&A, submitted [Google Scholar]
- Taylor, A. R., Wallace, B. J., & Goss, W. M. 1992, AJ, 103, 931 [NASA ADS] [CrossRef] [Google Scholar]
- Taylor, J. H., & Cordes, J. M. 1993, ApJ, 411, 674 [NASA ADS] [CrossRef] [Google Scholar]
- Terlouw, J. P., & Vogelaar, M. G. R. 2015, Kapteyn Package, Version 2.3 (Groningen: Kapteyn Astronomical Institute), Available from http://www.astro.rug.nl/software/kapteyn/ [Google Scholar]
- Tian, W. W., & Leahy, D. A. 2013, ApJ, 769, L17 [NASA ADS] [CrossRef] [Google Scholar]
- van Haarlem, M. P., Wise, M. W., Gunst, A. W., et al. 2013, A&A, 556, A2 [NASA ADS] [CrossRef] [EDP Sciences] [Google Scholar]
- van Leeuwen, J., & Stappers, B. W. 2010, A&A, 509, A7 [NASA ADS] [CrossRef] [EDP Sciences] [Google Scholar]
- van Leeuwen, J., & Verbunt, F. 2004, in Young Neutron Stars and Their Environments, eds. F. Camilo, & B. M. Gaensler, IAU Symp., 218, 41 [NASA ADS] [Google Scholar]
- van Leeuwen, J., Kasian, L., Stairs, I. H., et al. 2015, ApJ, 798, 118 [NASA ADS] [CrossRef] [Google Scholar]
- Wallace, B. J., Landecker, T. L., & Taylor, A. R. 1997, AJ, 114, 2068 [NASA ADS] [CrossRef] [Google Scholar]
- Welsh, B. Y., & Sallmen, S. 2003, A&A, 408, 545 [NASA ADS] [CrossRef] [EDP Sciences] [Google Scholar]
- Weltevrede, P., Abdo, A. A., Ackermann, M., et al. 2010, ApJ, 708, 1426 [NASA ADS] [CrossRef] [Google Scholar]
- Yao, J. M., Manchester, R. N., & Wang, N. 2017, ApJ, 835, 29 [NASA ADS] [CrossRef] [Google Scholar]
All Tables
Expected DM upper limit on the mean flux density Smin, and maximum possible pseudo-luminosity Lmax for each of the sources.
All Figures
|
Fig. 1. Beam pattern for the eight observations, ordered from largest diameter (top left panel) to smallest (bottom right panel). Observations in the top row all employ 91 tied array beams. In the bottom row, patterns contain either 7 beams (left panel) or 1 beam (right panel). The general beam numbering pattern is visible in the top left panel. For the respective sources, the background contours (grey) and observation bounding boxes (light grey) are derived from: G65.3+5.7: ROSAT 0.44−1.21 keV (Shelton et al. 2004). The position of pulsar J1931+30 is indicated by a black circle; G150.3+4.5: Effelsberg 1.4 GHz (Gao & Han 2014); G49.2−0.7: VLA 1.4 GHz (Koo et al. 2005); G93.3+6.9: DRAO Synthesis Telescope 1.4 GHz (Landecker et al. 1999); G63.7+1.1: Westerbork Synthesis Radio Telescope (WSRT) 1.4 GHz (Wallace et al. 1997) in grey; X-ray nebula (Matheson et al. 2016) in black; G141.2+5.0: WSRT 327 MHz (Kothes et al. 2014). Here our candidate-confirmation pointing is marked with a dashed ellipse; G74.9+1.2: VLA 1.4 GHz (Liu et al. 2018). The X-ray nebula identified by Matheson et al. (2013) is marked with a cross; G189.1+3.0: VLA 8.5 GHz (Gaensler et al. 2006). |
| In the text | |
|
Fig. 2. Candidate detection toward G141.2+5.0. The signal is broadband and present throughout the entire 3-hour observation. The DM is 226 pc cm−3, consistent with the expected distance and contribution of the nebula itself. Its period of 94.13 ms is compatible with a young pulsar. |
| In the text | |
|
Fig. 3. Our sensitivity limits (left, at 150 MHz) compared to applicable earlier work. For previous searches that did not cover the entire supernova remnant size, the searched fraction is indicated. Per frequency only the most sensitive limits obtained are shown. A grid is overlaid with spectral slope α = −1.4 to indicate the scaling of our sensitivity limits (Bates et al. 2013). For visibility our limits are plotted slightly offset from the 150 MHz observing frequency (dashed line). |
| In the text | |
Current usage metrics show cumulative count of Article Views (full-text article views including HTML views, PDF and ePub downloads, according to the available data) and Abstracts Views on Vision4Press platform.
Data correspond to usage on the plateform after 2015. The current usage metrics is available 48-96 hours after online publication and is updated daily on week days.
Initial download of the metrics may take a while.