Fig. 1.
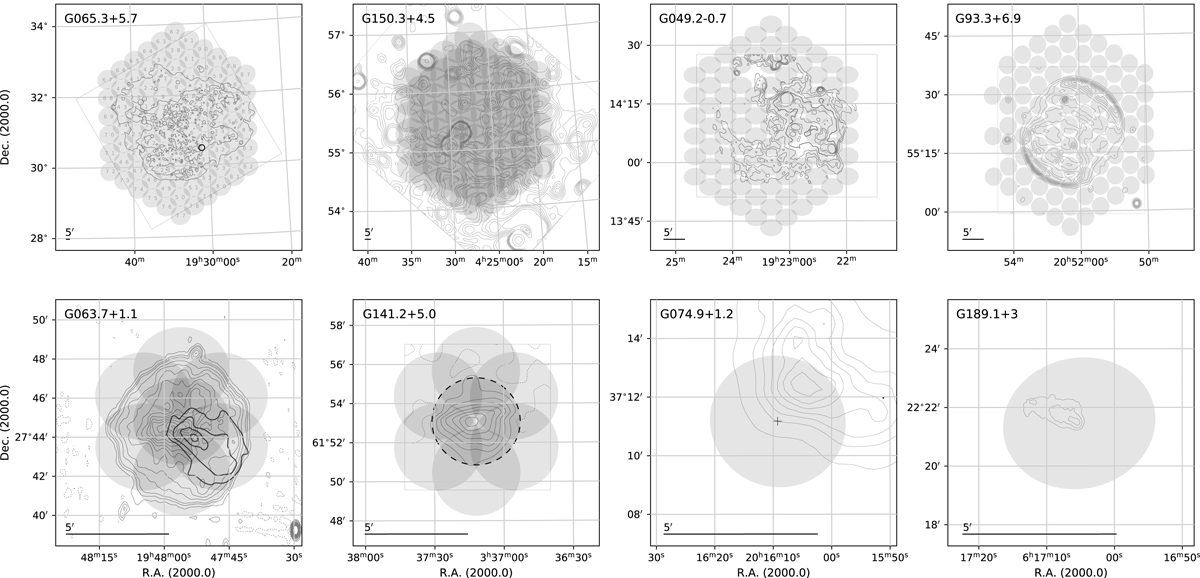
Beam pattern for the eight observations, ordered from largest diameter (top left panel) to smallest (bottom right panel). Observations in the top row all employ 91 tied array beams. In the bottom row, patterns contain either 7 beams (left panel) or 1 beam (right panel). The general beam numbering pattern is visible in the top left panel. For the respective sources, the background contours (grey) and observation bounding boxes (light grey) are derived from: G65.3+5.7: ROSAT 0.44−1.21 keV (Shelton et al. 2004). The position of pulsar J1931+30 is indicated by a black circle; G150.3+4.5: Effelsberg 1.4 GHz (Gao & Han 2014); G49.2−0.7: VLA 1.4 GHz (Koo et al. 2005); G93.3+6.9: DRAO Synthesis Telescope 1.4 GHz (Landecker et al. 1999); G63.7+1.1: Westerbork Synthesis Radio Telescope (WSRT) 1.4 GHz (Wallace et al. 1997) in grey; X-ray nebula (Matheson et al. 2016) in black; G141.2+5.0: WSRT 327 MHz (Kothes et al. 2014). Here our candidate-confirmation pointing is marked with a dashed ellipse; G74.9+1.2: VLA 1.4 GHz (Liu et al. 2018). The X-ray nebula identified by Matheson et al. (2013) is marked with a cross; G189.1+3.0: VLA 8.5 GHz (Gaensler et al. 2006).
Current usage metrics show cumulative count of Article Views (full-text article views including HTML views, PDF and ePub downloads, according to the available data) and Abstracts Views on Vision4Press platform.
Data correspond to usage on the plateform after 2015. The current usage metrics is available 48-96 hours after online publication and is updated daily on week days.
Initial download of the metrics may take a while.