| Issue |
A&A
Volume 667, November 2022
|
|
|---|---|---|
| Article Number | A71 | |
| Number of page(s) | 8 | |
| Section | Interstellar and circumstellar matter | |
| DOI | https://doi.org/10.1051/0004-6361/202244369 | |
| Published online | 08 November 2022 | |
Possible discovery of Calvera’s supernova remnant
1
Leiden Observatory, Leiden University,
PO Box 9513,
2300RA
Leiden, The Netherlands
e-mail: This email address is being protected from spambots. You need JavaScript enabled to view it.
2
ASTRON Netherlands Institute for Radio Astronomy,
Oude Hoogeveensedijk 4,
7991 PD
Dwingeloo, The Netherlands
3
School of Physical Sciences and Centre for Astrophysics & Relativity, Dublin City University,
Glasnevin
D09 W6Y4, Ireland
4
Centre for Astrophysics Research, Department of Physics, Astronomy and Mathematics, University of Hertfordshire,
College Lane,
Hatfield
AL10 9AB, UK
5
GEPI & USN, Observatoire de Paris, Université PSL, CNRS,
5 Place Jules Janssen,
92190
Meudon, France
6
Department of Physics & Electronics, Rhodes University,
PO Box 94,
Grahamstown
6140, South Africa
7
Anton Pannekoek Institute for Astronomy, University of Amsterdam,
Science Park 904,
1098XH
Amsterdam, The Netherlands
Received:
28
June
2022
Accepted:
22
July
2022
Abstract
We report the discovery of a ring of low surface brightness radio emission around the Calvera pulsar, a high Galactic latitude, isolated neutron star, in the LOFAR Two-metre Sky Survey (LoTSS). It is centered at α = 14h11m12s.6, δ = +79°23′15″, has inner and outer radii of 14′.2 and 28′.4, and has an integrated flux density at 144 MHz of 1.08 ± 0.15 Jy. The ring center is offset by 4′.9 from the location of the Calvera pulsar. Observations with the Isaac Newton Telescope in the Hα band show no coincident optical emission, but they do show a small (~20″) optical structure internal to the ring. We consider three possible interpretations for the ring: that it is an H II region, a supernova remnant (SNR), or an odd radio circle (ORC). The positional coincidence of the ring, the pulsar, and an X-ray-emitting non-equilibrium ionization plasma previously detected lead us to prefer the SNR interpretation. If the source is indeed a SNR and if its association with the Calvera pulsar is confirmed, then Calvera’s SNR, or G118.4+37.0, will be one of few SNRs in the Galactic halo.
Key words: surveys / ISM: supernova remnants / H II regions / ISM: general / pulsars: individual: 1RXS J141256.0+792204
© M. Arias et al. 2022
 Open Access article, published by EDP Sciences, under the terms of the Creative Commons Attribution License (https://creativecommons.org/licenses/by/4.0), which permits unrestricted use, distribution, and reproduction in any medium, provided the original work is properly cited.
This article is published in open access under the Subscribe-to-Open model. This email address is being protected from spambots. You need JavaScript enabled to view it. to support open access publication.
1 Introduction
The LoTSS (Shimwell et al. 2017) is an ongoing survey of the northern sky at 120–168 MHz, with 6″ resolution and ≲100 μJy beam−1 sensitivity1. There have been two LoTSS data releases (Shimwell et al. 2019, 2022) which have enabled a wide variety of scientific results.
While processing proprietary data from LoTSS, we have discovered a ring of diffuse radio emission encompassing the celestial position of the isolated neutron star Calvera (1RXSJ141256.0+792204). It is a degree-scale circular structure at high Galactic latitude (l = 37°), which may or may not be associated with the Calvera neutron star.
1RXS J141256.0+792204 is an isolated neutron that so far defies classification into the established types of neutron stars. Initially identified as a candidate thermally emitting isolated neutron star by Rutledge et al. (2008), and having been selected due to its soft X-ray spectrum and high X-ray to optical flux ratio from the ROSAT All-Sky Survey (RASS, Voges et al. 1999), it was nicknamed “Calvera” due to its similarities with the seven nearby X-ray dim isolated neutron stars (XDINS), colloquially named the “Magnificent Seven” (Haberl 2007). However, its high blackbody temperature set it apart from the XDINS, a distinction further confirmed by the discovery of X-ray pulsations at a 59 ms spin period (Zane et al. 2011), which is much shorter than the several second spin periods of the “Magnificent Seven,” and by a distance estimate of 3.3 kpc (Mereghetti et al. 2021), which is much larger than the few hundred parsec distances of the other XDINS. X-ray timing yields dipolar spindown properties ( ) which are more in line with those of young radio pulsars (Halpern et al. 2013; Bogdanov et al. 2019; Mereghetti et al. 2021), disfavoring the classification as a nearby millisecond pulsar or a central compact object (CCO). On the other hand, the absence of radio pulsations (Hessels et al. 2007; Zane et al. 2011) or gamma-ray pulsations (Halpern 2011; Halpern et al. 2013; Mereghetti et al. 2021) is somewhat inconsistent with those of young radio pulsars.
Here, we report the detection of a diffuse radio ring around the Calvera pulsar. We also discuss three possible scenarios: that it is an HII region, that it is a supernova remnant (SNR), possibly associated with Calvera, or that it is an odd radio circle (ORC).
2 Observations and analysis
2.1 Radio continuum imaging
Visual inspection of radio continuum images obtained as part of the ongoing LoTSS (Shimwell et al. 2017) led to the discovery of a ~1° diameter diffuse ring-like structure at l = 118°4, b = +37°.0 in the 8 h LoTSS pointing P207+77 (observed on 2019 September 19). The presence of the ring was confirmed in two nearby LoTSS pointings, P207+80 and P222+80, observed on 2022 January 29 and 2022 February 6, respectively, both with 8 h exposures. The LoTSS pointings were offset from the center of the ring by 2°20 (P207+77), 1°04 (P207+80), and 1°93 (P222+80). These pointings were processed by the LOFAR Surveys Key Science Project team, employing the ddf-pipeline2 developed to reduce LoTSS observations (Shimwell et al. 2017, Shimwell et al. 2019, 2022), which delivers direction-dependent corrected mosaics at 6″ and 20″ resolution (see Tasse et al. 2021, for more details). The imaging is done using the multiscale cleaning algorithm described in Offringa & Smirnov (2017).
Since the edges of the ring are not sharp, we estimate its center, radius, and width by modeling it as a circularly-symmetric radially offset Gaussian. Starting with a 1°25 × 1°25 section centered on the ring from the 20 resolution LoTSS image, all pixels above the 98% percentile (0.7 mJy beam−1) were masked. The masked shapes were expanded by one pixel through a single binary dilation operation to mask the fainter wings of point sources. In the resulting image, 3.1% of the pixels were masked. The unmasked pixels were used in a least-squares minimization of the circularly symmetric Gaussian, fitting for the Gaussian width, the radial offset around the center, as well as the Gaussian amplitude above some constant background.
To measure the integrated flux density of the ring, we further processed the LoTSS data using the “extraction and selfcal” method described in van Weeren et al. (2021). This method allows one to correct for residual calibration artifacts while permitting fast and flexible reimaging of a smaller portion of the dataset. We focused on a squared region of 1.1 deg2 centered on the ring and obtained a new image with WSClean (Offringa et al. 2014) at 30″ resolution. In this image, obtained using a minimum uv cut of 60λ (corresponding to an angular size of ~57′), discrete sources were subtracted from the visibilities using the clean components created from a previous imaging run at higher resolution (created with a minimum uv cut of 1000λ to filter out the ring).
2.2 Radio polarization
The LoTSS data products include linear polarization Stokes Q and Stokes U cubes with a spatial resolution of 20″. To search for linearly polarized emission, we used the rotation measure synthesis technique (Brentjens & de Bruyn 2005) on the 3′ resolution Q and U channel images with pyrmsynth_lite3. There were 480 Q and U images from 120 MHz to 168 MHz. We searched the band-averaged polarized intensity images across a Faraday depth range of ±100 rad m−2 with a sampling of 0.5 rad m−2 and found no evidence for polarized emission associated with the ring at a level of 300 μJy beam−1. This is a higher noise than is typical for LoTSS images, but this is due to the fact that the ring is located at the edge of the observing field. More details on the rotation measure synthesis method developed for LoTSS data products can be found in O’Sullivan et al. (in prep.).
2.3 Beamformed radio observations
A high-time resolution Stokes I observation (ObsID: L257877) of Calvera was obtained on 2015 January 16 using the inner 22 LOFAR HBA core stations in beamforming mode, providing a 3′.5 tied-array beam pointed at the position of Calvera. The observation was 3 h in length with 78.125MHz of bandwidth, centered at 149 MHz, and with 163.84 μs time resolution and 12.2 kHz frequency resolution. For this observational setup, smearing due to dispersion reaches 1 ms at a dispersion measure (DM) of about 30 pc cm−3 and 3 ms at DM = 80 pc cm−3. Models for the Galactic electron distribution predict maximum DMs of 42.2 pc cm−3 at 10.1 kpc (NE2001, Cordes & Lazio 2002) and 35.5 pc cm−3 at 15.2kpc (YMW16, Yao et al. 2017).
The observation was folded with the Halpern & Gotthelf (2015) X-ray timing ephemeris using dspsr (van Straten & Bailes 2011) to 10 s subintegrations. Though the observation epoch falls outside of the timing span of both the Halpern & Gotthelf (2015) and Mereghetti et al. (2021) timing ephemerides, extrapolating these to the observation epoch yields consistent folding periods (ΔΡ = −17.6 ± 6.9 ns). Using PSRCHIVE (Hotan et al. 2004) tools, radio frequency interference (RFI) was masked and the folded observation was subsequently dedispersed to 401 trial DMs between 0 and 80 pc cm−3 at 0.2 pc cm−3 steps. Each DM trial was averaged to 128 pulse phase bins, 0.78 MHz frequency channels, and 100s subintegrations and searched for periodicities within 280 ns around the folding period and DM offsets of −0.23 to 0.23 pc cm−3 with pdmp. No periodicities with a significance over 7σ were found. The flux calibration method by Kondratiev et al. (2016) estimates sensitivity limits of 0.25 mJy for an assumed fractional pulse width of 10% (0.8 mJy for 50%) at 7σ.
The observation was also searched for emission from single pulses using tools from the PRESTO software suite (Ransom 2001). After RFI masking, dedispersed time series were created for DMs up to 80 pc cm−3, with steps of 0.002 pc cm−2 up to 10 pc cm−3 at the native time resolution, 0.005 pc cm−3 from 10 to 22.5 pc cm−3 for a downsampled time resolution of 0.655 ms, and 0.02 pc cm−3 at 1.31 ms. Single pulse candidates with DMs below 0.2 pc cm−3 were discarded due to pollution by zero DM RFI, while all other events above a significance of 7σ were visually inspected. Unfortunately, no astrophysical pulses were detected as all remaining events could be attributed to time ranges affected by RFI. We estimate 7σ fluence limits of 2.6 Jy ms for 1 ms wide signals.
2.4 Optical observations
We also observed the region around Calvera and a section of the radio ring with the Wide Field Camera (WFC) on the 2.5 m Isaac Newton Telescope (INT) in La Palma. Our initial aims were to search for optical forbidden line emission from the radio shell which would indicate radiative SNR shocks, and for the presence of a bow shock near Calvera which could help us constrain its direction of motion. The region was observed for three nights (2022, March 19, 20, and 23) in the Hα and r-band filters.
In order to reduce the optical observing data, we used the automated astronomical data reduction pipeline from THELI (Erben et al. 2005; Schirmer 2013). THELI provided the astrom-etry and relative photometry to combine the observations of a single observation night. For every single observation, THELI subtracted the sky with a model. To model the sky, THELI uses SExtractor (Bertin & Arnouts 1996) to remove all sources, dynamically fills the gaps in the field, and convolves the resulting field with a Gaussian kernel of 256 pixels. Finally, we used THELI to coadd the observations of a single observation night and perform a flux calibration with known field sources from Pan-STARRS (Chambers et al. 2016). For the r-band and Hα, we also combined the observations for different nights. The r-band and Hα images were photometrically calibrated against the PanSTARSS r-band magnitudes (Chambers etal. 2016) using THELI.
No emission associated with either the radio ring or a bow shock was detected in Hα (174 min of exposure time). We estimate a 5σ limit on Hα surface density flux of 1.1 × 10⁻¹⁶ erg cm−2 s−1 arcsec−2.
We did detect, though, a smudge of Ha emission centered at αJ2000 = 14h08m28s.3, δJ2000 = +79°22′54″.0. The extended emission is faint, with an Ha surface brightness of 24.0 mag arcsec−2 ; it is somewhat V-shaped, and at its longest it is 23″ across. Figure 2 shows the Hα and r-band images, as well as the continuum subtracted Hα image for a region surrounding the smudge. There is no clear radio emission associated with the Ha smudge; although, there is a point source that almost overlaps with the smudge, and so it is hard to tell if faint extended emission is also present. We examined the four WISE bands for emission in this region and found no clear IR counterpart. The smudge is unlikely to be of extra-galactic origin for several reasons: its angular scale, the fact that it does not overlap in full with a galaxy, and the fact that it falls within the redshift range of the filter (z < 0.007, for an Ha filter bandpass of 95 Å4).
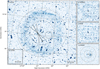 |
Fig. 1 Possible Calvera supernova remnant. (a) Radio emission from the diffuse ring at 144 MHz in the LOFAR HBA LoTSS imaging mosaic (1°25 × 1°25 field of view, 20″ resolution). The location of Calvera is indicated with a circle, with the arrow representing the Halpern & Gotthelf (2015) proper motion from 10kyr in the past to 10kyr into the future. The dashed lines indicate the propagated 1σ positional uncertainty due to proper motion. The cross sign indicates the estimated center of the diffuse ring, with the dotted circles representing the inner and outer radii. The dashed circle (4′ radius) denotes the location of the diffuse X-ray emission seen by Zane et al. (2011) from 1RXS J140818.1+792113, with the square indicating the location of Ha emission. (b) The diffuse ring in the Westerbork Synthesis Radio Telescope WENSS survey imaging at 325 MHz and (c) the Very Large Array NVSS survey at 1.4 GHz. Both panels have a 1°25 × 1°25 field of view and an identical pointing and orientation to panel a. (d) The 0.1-2.4 keV X-ray image from RASS (Voges et al. 1999), with the ring center and inner outer radii of the radio ring denoted by the cross and dotted circles. The dashed circle encircles the emission from 1RXS J140818.1+792113. (e) A 2′ × 2′ section of the 6″ resolution LoTSS imaging mosaic at the location of Calvera, indicated with the dotted circle (10″ radius). |
3 Results
3.1 Detection of a radio ring
We report the detection of radio emission from a degree-scale diffuse ring in LoTSS radio continuum imaging at 144 MHz. Figure 1a shows the diffuse ring in the LoTSS radio continuum mosaic. The ring is located at α = 14h11m12.6, δ = +79°23′15″, corresponding to a Galactic position of l = 118°.41, b = 37°.03. The ring has a full width at half maximum of 8.′5 and we conservatively estimate an inner diameter of 28′.4 and an outer diameter of 56.′8 (see Fig. 1). These correspond to a physical inner and outer diameter of 8.2pc and 16.5 pc for a distance of 1 kpc. The ring does not seem to have a sharp inner or outer edge, and its brightness is relatively constant, both radially and in position angle, except for a brighter, straight filament in the northwest. After subtracting the point sources from the LoTSS mosaic, we measured an integrated flux density of 1.08 + 0.15 ly at 144 MHz (corresponding to the area between the dotted concentric circles in Fig. 1). The uncertainty includes the statistical error and the systematic error on the flux scale (10% of the measured flux density of the ring, following LoTSS Data Release 2, Shimwell et al. 2022).
Knowing the location and extent of the ring, we searched for its presence in other radio continuum surveys. Radio emission of the diffuse ring is detected at low significance in the WEsterbork Northern Sky Survey (WENSS, Rengelink et al. 1997) at 325 MHz (Fig. lb), and at even lower significance in the NRAO VLA Sky Survey (NVSS, Condon et al. 1998) at 1.4 GHz (Fig. 1c). The ring is not detected in the NRAO VLA Low-frequency Sky Survey (VLSS; Cohen et al. 2007; Lane et al. 2014) at 74 MHz (0.7 Jy beam−1 sensitivity) or the TIFR GMRT Sky Survey (TGSS; Intema et al. 2017) at 150 MHz (5 mly beam−1 sensitivity). The integrated flux densities of the ring in the surveys where it is detected are summarized in Table 1, and they correspond to a best-fit spectral index value of -0.71 + 0.09 (for power-law radio spectra with observing frequency ν of the form Sv ∝ v∝).
The full area encompassed by the radio ring has only been observed in the X-rays as part of RAS S (Voges et al. 1999)5, and no X-ray emission coincident with the radio emission is detected (see Fig. Id). Two ROSAT X-ray sources from the bright source catalog (Voges et al. 1999) are coincident with the extent of the ring, the Calvera X-ray pulsar (1RXS 1141256.0+792204) and 1RXS 1140818.1+792113. Zane et al. (2011) found that the latter source is extended and has a soft spectrum in XMM-Newton observations covering the inner region of the ring, and that its X-ray spectrum is best modeled as a non-equilibrium ionization (NEI) plasma.
The Calvera X-ray pulsar is offset by 4′.9 from the center of the radio ring, which is well within its inner radius. No other radio, X-ray, or gamma-ray pulsar from the ATNF Pulsar Catalogue (Manchester et al. 2005, version 1.67) is located within the ring. Another eight radio pulsars are within a 10° radius, with the closest one at an offset of 2°.85.
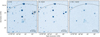 |
Fig. 2 Detection of extended Hα emission in the INT/WFC observations in the narrowband Hα filter (panel a), the broadband r-band filter (panel b), and the continuum subtracted Hα-r (panel c). Each panel shows a 4′ × 4′ field of view, with the dashed circle representing the extent of the diffuse X-ray emission from 1RXS 1140818.1+792113 (see Fig. 1). Radio contours from the 6″ LOFAR mosaic are overlaid in panel a. |
Integrated flux density of the ring centered at α = 14h1 1ml2s.6, δ = +79°23′15″, with inner and outer radii of 14′.2 and 28′.4 at various frequencies.
3.2 Nondetection of Calvera in LOFAR observations
No radio emission is detected in the LoTSS radio continuum mosaic at the location of Calvera (Fig. 1e), either as a point source from pulsed or unpulsed emission, or as extended emission from a pulsar wind nebula (PWN). The rms noise measured at the location of Calvera in the 6″ resolution map is 75 μJy beam−1; therefore, we estimate a 3σ flux density upper limit of 225 μJy for Calvera’s radio continuum emission at 144 MHz.
The beamformed LOFAR observations also fail to detect pulsed radio emission at the known spin period of Calvera, or as single pulses down to flux density and fluence limits of 0.25 mly and 2.6 ly ms at 149 MHz, respectively. These limits add to previous pulsed flux density upper limits of 4 mly at 385 MHz and 0.3 mly at 1380 MHz by Hessels et al. (2007), using the Westerbork Synthesis Radio Telescope and 0.05 mly at 1360MHz with the Effelsberg telescope (Zane et al. 2011). These observations confirm that Calvera is a radio quiet pulsar.
3.3 Statistical modeling of the probability of chance alignment
Although chance alignments between pulsars and SNRs are frequent in the Galactic plane (Gaensler & lohnston 1995), at such high Galactic latitudes both pulsars and remnants are rare. We performed some Monte Carlo simulations so as to quantify the likelihood of a chance alignment.
In order to find the probability that a pulsar falls within a fixed area with the coordinates and diameter of our radio ring (which we consider to be one degree), we simulated many iterations of pulsar populations and counted the number of times that a pulsar fell within the radio circle. Each sample pulsar was generated with a set of Galactocentric coordinates (r, θ, h), where r is the Galactocentric radius, θ is the polar angle, and h is the height above or below the Galactic plane. We sampled r according to the distribution given by Yusifov & Kücük (2004) in Galactocentric radius, and θ by drawing from a uniform distribution between 0 and 2π. To sample h, we tried using exponential distributions with scale heights of 100 pc, 330 pc, and 350 pc (Faucher-Giguère & Kaspi 2006; Lorimer et al. 2006; Mdzinarishvili & Melikidze 2004) and found that the simulated sample, once we converted to heliocentric coordinates, was very compact in Galactic latitudes. In runs of 10,000 Monte Carlo iterations, the rate at which a pulsar fell within the area of the radio ring was consistently less than 5 × 10⁻⁴. On average, this distribution produced one pulsar within a 10° radius centered at Calvera, whereas we observed nine in such a region, which suggests that the scale height distributions in the above references do not describe this local region of the Galaxy well.
Given that the simulated populations sampled from the exponential distributions seemed to generate pulsars whose Galactic latitudes were too low, we also simulated the distribution in h empirically. We used the ATNF Pulsar Catalogue vl.67 (Manchester et al. 2005), removing pulsars in globular clusters or in the Magellanic Clouds, in order to make a histogram of the distribution in heights above the Galactic plane (using the dispersion measure distances). Then, we sampled from the midpoints of the histogram bins, adding some noise so as to not sample in discrete heights above or below the plane. Naturally, since we sampled from the ATNF Pulsar Catalogue vl.67 empirical distribution, we recovered the observed value of nine pulsars in a 10° radius on average. Our Monte Carlo simulations gave a probability of chance alignment smaller than 0.01.
These are rough calculations and cannot be the basis to claim that Calvera and the radio ring are aligned. However, they are a good indication that it is very unlikely that their positional coincidence is by chance.
4 The nature of the radio ring
4.1 An H II region
The thermally emitting H II regions have a radio spectral index of >−0.2 (Condon & Ransom 2016), which is already quite different from the best-fit spectral index value of −0.71 + 0.09 that we find here. They also emit profusely in Ha (e.g., Haffner et al. 2009), which we do not detect. Moreover, the area around Calvera was observed as part of the Wide-field Infrared Survey Explorer (WISE, Wright et al. 2010) all-sky survey. We examined the four WISE bands for emission coincident with the radio ring and detected no emission above the image noise. Anderson et al. (2014) argue that the WISE survey should be able to detect the mid-infrared emission from all Galactic H II regions. Moreover, Makai et al. (2017) calculated the correlations between the radio and IR flux densities of Galactic H II regions. Using the values (for regions > 1 pc) from their Table 2 and a radio spectral index of −0.1, we would expect F8 μm ~ 40 Jy, F12 μm ~ 80 Jy, and F22 μm ~ 90 Jy if the ring were an Η II region. Even for a source with an area >1800 arcmin2, these values are well within the extended source sensitivities of their respective WISE bands.
In addition to the electromagnetic evidence against the H II interpretation, the morphology also points against it. The circular shape of the source seems to imply that it is ionised from within; however, a query of a 1 degree radius around the coordinates of Calvera in the Catalog of Galactic OB Stars (Reed 2003) yielded no results. We therefore discard the possibility that the ring is an HII region.
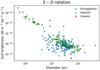 |
Fig. 3 1 GHz surface brightness versus diameter for the Vukotic et al. (2019) sample of Galactic SNRs with known distances (blue) and the Urosevic et al. (2005) sample of extragalactic SNRs. The purported Calvera SNR was plotted in red using the measured surface brightness at 144 MHz and the best-fit spectral index of 0.71, and the 54 pc diameter derived from the 3.3 kpc distance estimate of Mereghetti et al. (2021). |
4.2 A supernova remnant
The measured radio spectral index of -0.71 + 0.09 already presents a good indication that the radio emission is of a synchrotron origin, characteristic of SNRs (Dubner & Giacani 2015). In addition to this, there are two main pieces of evidence that support a SNR interpretation for the ring around Calvera: the low probability of a chance alignment between the pulsar and the radio source (see Sect. 3.3), and the presence of the extended X-ray source 1RXS J140818.1+792113. The fact that a possible association exists between all three objects is what strengthens the SNR interpretation. Of course, there still exists the possibility that the source is a SNR with no relation to the Calvera pulsar, other than the positional overlap. However, this would require two stars exploding in the same line of sight at a Galactic latitude where SNRs are infrequent - the Green (2019) catalogue lists 294 SNRs, only three of which are at b > 10°, and none are above b = 15°. Our favored interpretation is that this radio ring is the remnant of the supernova explosion that formed the Calvera pulsar. This would make the source SNR G118.4+37.0, or Calvera’s SNR.
Perhaps the most convincing piece of evidence that the radio emission is from a SNR is 1RXS J140818.1+792113: Zane et al. (2011) found extended soft X-ray emission in XMM-Newton MOS and RASS maps (indicated with a dashed line in Fig. 1a and d). They performed a spectral analysis on the data and found that the spectrum is well fitted by a NEI model with an overabundance of oxygen; the NEI is a typical signature of SNRs in general, and the oxygen overabundance of SNRs with a core-collapse origin (Vink 2012). The extended emission is also visible in the public Chandra HRC-I observations used in Halpern & Gotthelf (2015). The region of extended emission has an angular separation of 13′ with Calvera, which led Zane et al. (2011) to suggest that the two sources are unrelated. However, both are encompassed by the ring, and all three (the pulsar, the NEI plasma, and the shell) could well be the remains of a single stellar explosion. The additional possibility that only two of these components are related – the plasma and the ring but not the pulsar, or any such combination – exists. However, the presence of a SNR plasma inside the radio ring is very indicative that the ring is a SNR, irrespective of whether the two are associated with Calvera. A final point to be made regarding the NEI plasma is that the relation between the Hα smudge and the X-ray emitting material remains unclear. Follow-up spectroscopy of the smudge could determine whether both have similar compositions.
Mereghetti et al. (2021) estimated the distance to the Calvera pulsar to be 3.3 kpc (by assuming a neutron star radius of 13 km and fitting the thermal emission), and that the supernova explosion occurred in the Galactic halo. At this distance, the SNR would have a diameter of 54 pc, and it would be at a height over the Galactic plane of 2 kpc. This would make Calvera’s SNR, along with the remnant of SN1006 (Raymond et al. 2017), one of the known remnants with a largest height above the Galactic plane (with the important difference being that Calvera’s SNR would be the remnant of a core-collapse explosion). Getting the (massive) progenitor star to such a large height above the Galactic plane could require a high velocity runaway scenario: a star with a vertical velocity of 100 km s−1 would take ~30 Myr to reach it, which points to a star in the low-mass end of core-collapse explosions (8−10 M⊙), or alternatively a star in some kind of binary interaction that extends its lifetime (e.g., as discussed in Zapartas et al. 2021). Hypervelocity runaway stars are rare (Renzo et al. 2019), but certainly can be responsible for core-collapse supernovae in the outskirts of galaxies (e.g., Zinn et al. 2011). Alternatively, the neutron star need not be formed by a massive star at all if its origin is the accretion-induced or merger-induced collapse of a white dwarf (Grindlay & Bailyn 1988; Saio & Nomoto 1985). This solves the problem of the location of the progenitor; although, the oxygen overabundance noted in the X-ray plasma by Zane et al. (2011) favors a core-collapse origin.
For SNRs, there exists a relationship between their radio surface brightness at 1 GHz and their diameters, known as the Σ-D relation. Some authors (e.g., Green 2004) are sceptical of the soundness of this relation; however, when we plotted the diameter as derived from the Mereghetti et al. (2021) distance against the radio surface brightness for the purported Calvera SNR (see Fig. 3), the data point fell roughly in line with the samples of Galactic and extragalactic SNRs found in Vukotic et al. (2019) and Urosevic et al. (2005), respectively. Using the values for the Σ − D relation as found in Vukotic et al. (2019) for a 1 GHz surface brightness of 1.74 × 10⁻²³ Wm2 Hz−1 sr−1 (using the best-fit spectral index of −0.71 and the area between the inner and outer radii), we found a diameter of 62 pc, which is quite comparable to the 54 pc diameter as derived from the Mereghetti et al. (2021) distance.
An X-ray proper motion measurement by Halpern & Gotthelf (2015) places the location of Calvera at the time of explosion ~20′ away from the center of the ring (for an explosion that happened 8000 yr ago, see the discussion below; and for an explosion corresponding to the characteristic age of the pulsar, this distance is >6°). This could be interpreted as an indication that the two are not related. However, the uncertainties in the Chandra observations that produced this result (dominated by the short 2 ks HRC-I exposure obtained in 2007) and the uncertainty in the age of the pulsar itself are large. Moreover, an inhomogeneous environment can easily produce an offset between the SN explosion site and the SNR’s geometric center (Dohm-Palmer & Jones 1996). This need not result in an asymmetric remnant: Williams et al. (2013) show that a uniform explosion into a density gradient produces a circular remnant, but the center of the circle is different from the explosion site. These are plausible reasons for the observed misalignment; we cannot rule out association simply from these proper motion measurements.
Another issue that draws attention to itself is that the X-ray plasma does not overlap with the radio emission. This is uncommon, but not unheard of, in SNRs: for instance, RCW 86 has a patch of X-ray emission with no radio counterpart (Bamba et al. 2000). The presence of the optical smudge is also puzzling: the only interpretation we can think of is that the SNR shock encountered a small density discontinuity in its surrounding medium which caused it to become radiative at that location.
Another source of tension comes from the pulsar characteristic age, τc = 2.9 × 10⁵ yr (Halpern et al. 2013), which is well past the time when we expect a SNR to still be visible. However, characteristic ages often overestimate the true age of the pulsar; this is due to the fact that the characteristic age neglects the initial period of the pulsar. Since 59 ms is well within the distribution of birth periods inferred from modeling the pulsar population (e.g. Faucher-Giguère & Kaspi 2006), Calvera’s characteristic age is only an upper limit to its true age. A case in point are CCOs: thermal X-ray sources with no accompanying radio or gamma-ray emission that are associated with known SNRs, and which have characteristic ages ~108 yr (De Luca 2017). Moreover, although in general SNRs live for ~50 000 yr, we do not know what is the spread in lifetimes – it could be intrinsically large, given that a source’s lifetime is likely highly dependent on its environmental conditions. A SNR in the halo, where the ambient densities are low, could well live longer than 50 000 yr. However, the Sedov-Taylor self-similar solution (Sedov 1959; Taylor 1950), for an explosion energy of 1051 erg and a SNR radius of 54 pc, gives a SNR age much younger than that: 7700 yr for an ambient density of 4 × 10⁻⁴ cm−3 (we estimated the ambient density in the halo around Calvera using the model of Miller & Bregman 2013, with r = 9.5 kpc being the distance between Calvera and the center of the Galaxy). We do not know whether the conditions for self-similar evolution are present in this remnant, thus this age estimate needs to be considered with caution.
Finally, the ring shows no clear optical line emission. Abundant optical line emission is a common feature in aged SNRs: when a SNR shock is slowed down to approximately 200 km s−1, it begins to emit profusely in optical forbidden lines and it cools quickly (Vink 2012). However, a SNR’s cooling time and length scales depend on the preshock density (Raymond 1979), and in low density environments the SNR enters the radiative phase at lower velocities (corresponding to older ages). It is possible that the optical line emission is too faint for our optical observations to recover, or that the remnant still has not reached its radiative phase.
4.3 An odd radio circle
Odd radio circles, or ORCs (Norris et al. 2021b), are a recently discovered class of diffuse extragalactic objects, which were first detected in the Pilot Survey of the Evolutionary Map of the Universe (Norris et al. 2021c). They are faint, arcminute-sized circles of steep-spectrum radio emission at high Galactic latitudes with no corresponding diffuse emission at optical, infrared, or X-ray wavelengths (Norris et al. 2021a). At the time of writing this paper, there are only seven published ORCs (Norris et al. 2021a; Koribalski et al. 2021; Filipovic et al. 2022; Omar 2022), three of which have an elliptical galaxy at their center (referred to as their “host” galaxy). It is unclear what phenomena produce ORCs, and there is no evidence that the radio shells are associated with their “host” galaxies, other than the positional coincidence of the two. In fact, the most recently reported ORC (Filipovic et al. 2022) was suggested to be the remnant of an exploded runaway star that left its galaxy (the Large Magellanic Cloud), whereas the remaining ones are thought to be distant (z > 0.1) objects.
If further work disproves that the ring is a SNR, then it could be LOFAR’s second contribution to the list of known ORCs (the first being Omar 2022). The Pan-STARRS PS1 images and catalog (Chambers et al. 2016) shows no prominent galaxy near the center of the ring as seen in other ORCs; out of the 18 PS1 objects located within 1′ from the center of the ring, only a single source (WISE J141113.52+792336.4) appears slightly extended (1″ × 2″) and has WISE colors consistent with those of spiral galaxies. It is unclear whether this could be the ORC host galaxy if the radio ring would be identified as an ORC. However, the known ORCs are arcminute-sized objects, whereas the ring is ~ 1 degree in diameter. If the ring is an extra-galactic object with a comparable redshift to the other ORCs, this would require the mechanism that produces the ORCs to be able to create structures that span 1.5 orders of magnitude. A more likely scenario is that this is an ORC of the type found by Filipovic et al. (2022): a nearby source, rather than a distant object. A nearer location would solve the issue of its large scale, but it would take us back to the SNR interpretation. A final point is that, morphologically, the ORCs appear to be quite different from the ring discussed in this paper, as they tend to have more structure and be less symmetric.
5 Discussion
We are fairly confident that this ring of radio emission seen in LOFAR, WENSS, and the NVSS is the remnant of the explosion that formed Calvera. The main pieces of evidence are the presence of an X-ray plasma with enhanced metals and the rarity of a chance alignment with a pulsar at such high Galactic latitudes. We discard the H II region interpretation given the lack of infrared and Ha emission; the ORC interpretation remains a possibility, but the difference in size with the other known ORCs and the lack of a clear host galaxy candidate weaken it. An additional possibility is that the ring is a SNR unrelated to Calvera; although, this would require two supernova explosions occurring in a single line of sight a high Galactic latitude, which is unlikely.
More data are necessary to determine whether the ring is a SNR or an ORC. In particular, X-ray spectroscopy of the brighter filament at the northwest could unambiguously settle whether the ring is indeed a SNR. We do not know if the ring shows any optical emission at all, or whether the optical emission is too faint for our INT observations to detect any, but an optical follow-up of the ring will require deep exposures on dark conditions. Another set of follow-up observations that could be more interesting is optical spectroscopy of the Ha smudge, so as to clarify whether metals are also present in its spectrum and whether it has a similar composition to the X-ray emitting plasma. Finally, LOFAR LBA observations of the area at 58 MHz will better constrain the radio spectral index, and polarization studies at GHz frequencies can also help settle whether the ring is a SNR.
There are some implications for the Calvera pulsar if the radio ring is a SNR associated with it. Several authors (Zane et al. 2011; Halpern 2011; Halpern et al. 2013) have suggested that Calvera might be an “orphaned” or aged CCO, whose associated SNR either had faded away or was too faint to detect. The discovery of a SNR around it would place Calvera in the CCO category. The age of the pulsar would almost certainly be different from its characteristic age since the remnant seems to be on the younger side.
If confirmed to be a SNR, the ring around Calvera would be one of few SNRs with large heights above the Galactic plane. This would make it an interesting object for studies of SNR evolution in diffuse environments. Moreover, SNRs shock and heat the material they expand into, and in this way make visible the medium around them. SNRs at high Galactic latitudes are in a unique position to probe the interstellar medium (ISM) of the Milky Way halo. The combined analysis of deep X-ray and radio surveys, such as the one conducted by the eROSITA telescope (Predehl et al. 2021) on board the SRG observatory (Sunyaev et al. 2021), and the suite of surveys carried out with MeerKAT and LOFAR could discover a population of low surface brightness, high Galactic latitude remnants (e.g., Churazov et al. 2021, 2022; Becker et al. 2021, or the Calvera SNR in this work). These remnants could be longer-lived and fainter than SNRs in the Milky Way disk, given the low ambient densities in the halo.
6 Summary
We report the LOFAR 144 MHz discovery of a ring of diffuse radio emission centered at α = 14h1 1m12s.6, δ = +79°23′15″, with an outer radius Rout = 29′, an inner radius Rinn = 14′. We propose that the ring is the remnant from the explosion that produced the Calvera pulsar. Our conclusions are as follows:
The ring has an integrated flux density of 1.08 ± 0.15 Jy. The ring center is offset 4.87′ from the location of the Calvera pulsar. The ring shows low-significance emission at 325 MHz and 1.4 GHz, and no emission in any of the four WISE bands. Its spectral index is -0.71 ± 0.09;
We did not detect radio emission at 144 MHz from the Calvera pulsar; we report a 225 μJy 3σ upper limit for Calvera’s flux density at 144 MHz. We also fail to detect pulsed radio emission at the known spin period of Calvera, or as single pulses down to flux density and fluence limits of 0.25 mJy and 2.6Jyms at 149 MHz, respectively;
We detect no radiative emission from the ring in Hα. We do detect a smudge of extended Hα emission internal to the ring;
The nondetection of the ring in WISE and its radio spectral index value allow us to discard the possibility that the ring is an H II region;
We estimate the probability of chance alignment between the pulsar and the radio ring to be < 1%.
These observations lead us to favor an interpretation whereby the ring is the remnant of the supernova explosion that formed Calvera; although, more evidence is needed to support this scenario. A final possibility is that the ring is an ORC, but this is disfavored due to the ring’s difference in size with other known ORCs. If the ring is a SNR, it is uniquely suited to probe the ISM in the Galactic halo.
Acknowledgements
This paper is based (in part) on data obtained with the International LOFAR Telescope (ILT) under project codes LC3_036 and LT14_004. LOFAR (van Haarlem et al. 2013) is the LOw Frequency ARray designed and constructed by ASTRON. It has observing, data processing, and data storage facilities in several countries, which are owned by various parties (each with their own funding sources), and are collectively operated by the ILT foundation under a joint scientific policy. The ILT resources have benefitted from the following recent major funding sources: CNRS-INSU, Observatoire de Paris and Université d’Orléans, France; BMBF, MIWF-NRW, MPG, Germany; Science Foundation Ireland (SFI), Department of Business, Enterprise and Innovation (DBEI), Ireland; NWO, The Netherlands; The Science and Technology Facilities Council, UK; Ministry of Science and Higher Education, Poland; Istituto Nazionale di Astrofisica (INAF), Italy. This research made use of the Dutch national e-infrastructure with support of the SURF Cooperative (e-infra 180169) and the LOFAR e-infra group. The Jülich LOFAR Long Term Archive and the German LOFAR network are both coordinated and operated by the Jülich Supercomputing Centre (JSC), and computing resources on the supercomputer JUWELS at JSC were provided by the Gauss Centre for Supercomputing e.V. (grant CHTB00) through the John von Neumann Institute for Computing (NIC). This research made use of the University of Hertfordshire high-performance computing facility and the LOFAR-UK computing facility located at the University of Hertfordshire and supported by STFC [ST/P000096/1], and of the Italian LOFAR IT computing infrastructure supported and operated by INAF, and by the Physics Department of Turin University (under an agreement with Consorzio Interuniversitario per la Fisica Spaziale) at the C3S Supercomputing Centre, Italy. The Isaac Newton Telesccope is operated on the island of La Palma by the Isaac Newton Group of Telescopes in the Spanish Observatorio del Roque de los Muchachos of the Instituto de Astrofisica de Canarias. The WFC imaging was obtained as part of the Leiden education program. M.A. acknowledges support from the VENI research programme with project number 202.143, which is financed by the Netherlands Organisation for Scientific Research (NWO). A.B. acknowledges support from the VIDI research programme with project number 639.042.729, which is financed by the Netherlands Organisation for Scientific Research (NWO). R.J.vW. acknowledges support from the ERC Starting Grant ClusterWeb 804208. M.J.H. acknowledges support from the UK Science and Technology Facilities Council [ST/V000624/1].
References
- Anderson, L. D., Bania, T. M., Balser, D. S., et al. 2014, ApJS, 212, 1 [Google Scholar]
- Bamba, A., Koyama, K., & Tomida, H. 2000, PASJ, 52, 1157 [NASA ADS] [Google Scholar]
- Becker, W., Hurley-Walker, N., Weinberger, C., et al. 2021, A&A, 648, A30 [NASA ADS] [CrossRef] [EDP Sciences] [Google Scholar]
- Bertin, E., & Arnouts, S. 1996, A&AS, 117, 393 [NASA ADS] [CrossRef] [EDP Sciences] [Google Scholar]
- Bogdanov, S., Ho, W. C. G., Enoto, T., et al. 2019, ApJ, 877, 69 [Google Scholar]
- Brentjens, M. A., & de Bruyn, A. G. 2005, A&A, 441, 1217 [NASA ADS] [CrossRef] [EDP Sciences] [Google Scholar]
- Chambers, K. C., Magnier, E. A., Metcalfe, N., et al. 2016, ArXiv e-prints, [arXiv:1612.05560] [Google Scholar]
- Churazov, E. M., Khabibullin, I.I., Bykov, A. M., et al. 2021, MNRAS, 507, 971 [NASA ADS] [CrossRef] [Google Scholar]
- Churazov, E. M., Khabibullin, I.I., Bykov, A. M., et al. 2022, MNRAS, 513, L83 [NASA ADS] [CrossRef] [Google Scholar]
- Cohen, A. S., Lane, W. M., Cotton, W. D., et al. 2007, AJ, 134, 1245 [Google Scholar]
- Condon, J. J., & Ransom, S. M. 2016, Essential Radio Astronomy (Princeton University Press) [Google Scholar]
- Condon, J. J., Cotton, W. D., Greisen, E. W., et al. 1998, AJ, 115, 1693 [Google Scholar]
- Cordes, J. M., & Lazio, T. J. W. 2002, ArXiv e-prints [arXiv:astro-ph/0207156] [Google Scholar]
- De Luca, A. 2017, J. Phys. Conf. Ser., 932, 012006 [NASA ADS] [CrossRef] [Google Scholar]
- Dohm-Palmer, R. C., & Jones, T. W. 1996, ApJ, 471, 279 [NASA ADS] [CrossRef] [Google Scholar]
- Dubner, G., & Giacani, E. 2015, A&ARr, 23, 3 [NASA ADS] [CrossRef] [Google Scholar]
- Erben, T., Schirmer, M., Dietrich, J. P., et al. 2005, Astron. Nachr., 326, 432 [NASA ADS] [CrossRef] [Google Scholar]
- Faucher-Giguère, C.-A., & Kaspi, V. M. 2006, ApJ, 643, 332 [CrossRef] [Google Scholar]
- Filipović, M. D., Payne, J. L., Alsaberi, R. Z. E., et al. 2022, MNRAS, 512, 265 [CrossRef] [Google Scholar]
- Gaensler, B. M., & Johnston, S. 1995, MNRAS, 277, 1243 [NASA ADS] [CrossRef] [Google Scholar]
- Green, D. A. 2004, Bull. Astron. Soc. India, 32, 335 [NASA ADS] [Google Scholar]
- Green, D. A. 2019, J. Astrophys. Astron., 40, 36 [Google Scholar]
- Grindlay, J. E., & Bailyn, C. D. 1988, Nature, 336, 48 [NASA ADS] [CrossRef] [Google Scholar]
- Haberl, F. 2007, Ap&SS, 308, 181 [NASA ADS] [CrossRef] [Google Scholar]
- Haffner, L. M., Dettmar, R. J., Beckman, J. E., et al. 2009, Rev. Mod. Phys., 81, 969 [CrossRef] [Google Scholar]
- Halpern, J. P. 2011, ApJ, 736, L3 [NASA ADS] [CrossRef] [Google Scholar]
- Halpern, J. P., & Gotthelf, E. V. 2015, ApJ, 812, 61 [Google Scholar]
- Halpern, J. P., Bogdanov, S., & Gotthelf, E. V. 2013, ApJ, 778, 120 [NASA ADS] [CrossRef] [Google Scholar]
- Hessels, J. W. T., Stappers, B. W., Rutledge, R. E., Fox, D. B., & Shevchuk, A. H. 2007, A&A, 476, 331 [NASA ADS] [CrossRef] [EDP Sciences] [Google Scholar]
- Hotan, A. W., van Straten, W., & Manchester, R. N. 2004, PASA, 21, 302 [Google Scholar]
- Intema, H. T., Jagannathan, P., Mooley, K. P., & Frail, D. A. 2017, A&A, 598, A78 [NASA ADS] [CrossRef] [EDP Sciences] [Google Scholar]
- Kondratiev, V. I., Verbiest, J. P. W., Hessels, J. W. T., et al. 2016, A&A, 585, A128 [NASA ADS] [CrossRef] [EDP Sciences] [Google Scholar]
- Koribalski, B. S., Norris, R. P., Andernach, H., et al. 2021, MNRAS, 505, L11 [NASA ADS] [CrossRef] [Google Scholar]
- Lane, W. M., Cotton, W. D., van Velzen, S., et al. 2014, MNRAS, 440, 327 [Google Scholar]
- Lorimer, D. R., Faulkner, A.J., Lyne, A. G., et al. 2006, MNRAS, 372, 777 [NASA ADS] [CrossRef] [Google Scholar]
- Makai, Z., Anderson, L. D., Mascoop, J. L., & Johnstone, B. 2017, ApJ, 846, 64 [Google Scholar]
- Manchester, R. N., Hobbs, G. B., Teoh, A., & Hobbs, M. 2005, AJ, 129, 1993 [Google Scholar]
- Mdzinarishvili, T. G., & Melikidze, G. I. 2004, A&A, 425, 1009 [NASA ADS] [CrossRef] [EDP Sciences] [Google Scholar]
- Mereghetti, S., Rigoselli, M., Taverna, R., et al. 2021, ApJ, 922, 253 [NASA ADS] [CrossRef] [Google Scholar]
- Miller, M. J., & Bregman, J. N. 2013, ApJ, 770, 118 [NASA ADS] [CrossRef] [Google Scholar]
- Norris, R. P., Crawford, E., & Macgregor, P. 2021a, Galaxies, 9, 83 [NASA ADS] [CrossRef] [Google Scholar]
- Norris, R. P., Intema, H. T., Kapinska, A. D., et al. 2021b, PASA, 38, e003 [NASA ADS] [CrossRef] [Google Scholar]
- Norris, R. P., Marvil, J., Collier, J. D., et al. 2021c, PASA, 38, e046 [NASA ADS] [CrossRef] [Google Scholar]
- Offringa, A. R., & Smirnov, O. 2017, MNRAS, 471, 301 [Google Scholar]
- Offringa, A. R., McKinley, B., Hurley-Walker, N., et al. 2014, MNRAS, 444, 606 [Google Scholar]
- Omar, A. 2022, RNAAS, 6, 100 [NASA ADS] [Google Scholar]
- Predehl, P., Andritschke, R., Arefiev, V., et al. 2021, A&A, 647, A1 [EDP Sciences] [Google Scholar]
- Ransom, S. M. 2001, Ph.D. Thesis, Harvard University, USA [Google Scholar]
- Raymond, J. C. 1979, ApJS, 39, 1 [NASA ADS] [CrossRef] [Google Scholar]
- Raymond, J. C., Winkler, P. F., Blair, W. P., & Laming, J. M. 2017, ApJ, 851, 12 [NASA ADS] [CrossRef] [Google Scholar]
- Reed, B. C. 2003, AJ, 125, 2531 [NASA ADS] [CrossRef] [Google Scholar]
- Rengelink, R. B., Tang, Y., de Bruyn, A. G., et al. 1997, A&AS, 124, 259 [NASA ADS] [CrossRef] [EDP Sciences] [Google Scholar]
- Renzo, M., Zapartas, E., de Mink, S. E., et al. 2019, A&A, 624, A66 [NASA ADS] [CrossRef] [EDP Sciences] [Google Scholar]
- Rutledge, R. E., Fox, D. B., & Shevchuk, A. H. 2008, ApJ, 672, 1137 [NASA ADS] [CrossRef] [Google Scholar]
- Saio, H., & Nomoto, K. 1985, A&A, 150, L21 [NASA ADS] [Google Scholar]
- Schirmer, M. 2013, ApJS, 209, 21 [NASA ADS] [CrossRef] [Google Scholar]
- Sedov, L. I. 1959, Similarity and Dimensional Methods in Mechanics (Elsevier) [Google Scholar]
- Shimwell, T. W., Röttgering, H. J. A., Best, P. N., et al. 2017, A&A, 598, A104 [NASA ADS] [CrossRef] [EDP Sciences] [Google Scholar]
- Shimwell, T. W., Tasse, C., Hardcastle, M. J., et al. 2019, A&A, 622, A1 [NASA ADS] [CrossRef] [EDP Sciences] [Google Scholar]
- Shimwell, T. W., Hardcastle, M. J., Tasse, C., et al. 2022, A&A, 659, A1 [NASA ADS] [CrossRef] [EDP Sciences] [Google Scholar]
- Sunyaev, R., Arefiev, V., Babyshkin, V., et al. 2021, A&A, 656, A132 [NASA ADS] [CrossRef] [EDP Sciences] [Google Scholar]
- Tasse, C., Shimwell, T., Hardcastle, M. J., et al. 2021, A&A, 648, A1 [EDP Sciences] [Google Scholar]
- Taylor, G. 1950, Proc. R. Soc. Lond. A, 201, 159 [NASA ADS] [CrossRef] [Google Scholar]
- Urošević, D., Pannuti, T.G., Duric, N., & Theodorou, A. 2005, A&A, 435, 437 [NASA ADS] [CrossRef] [EDP Sciences] [Google Scholar]
- van Haarlem, M. P., Wise, M. W., Gunst, A. W., et al. 2013, A&A, 556, A2 [NASA ADS] [CrossRef] [EDP Sciences] [Google Scholar]
- van Straten, W., & Bailes, M. 2011, PASA, 28, 1 [Google Scholar]
- van Weeren, R. J., Shimwell, T. W., Botteon, A., et al. 2021, A&A, 651, A115 [NASA ADS] [CrossRef] [EDP Sciences] [Google Scholar]
- Vink, J. 2012, A&ARv, 20, 49 [Google Scholar]
- Voges, W., Aschenbach, B., Boller, T., et al. 1999, A&A, 349, 389 [NASA ADS] [Google Scholar]
- Vukotić, B., Ćiprijanović, A., Vučetić, M. M., Onic, D., & Urošević, D. 2019, Serb. Astron. J., 199, 23 [Google Scholar]
- Williams, B. J., Borkowski, K. J., Ghavamian, P., et al. 2013, ApJ, 770, 129 [Google Scholar]
- Wright, E. L., Eisenhardt, P. R. M., Mainzer, A. K., et al. 2010, AJ, 140, 1868 [Google Scholar]
- Yao, J. M., Manchester, R. N., & Wang, N. 2017, ApJ, 835, 29 [NASA ADS] [CrossRef] [Google Scholar]
- Yusifov, I., & Küçük, I. 2004, A&A, 422, 545 [NASA ADS] [CrossRef] [EDP Sciences] [Google Scholar]
- Zane, S., Haberl, F., Israel, G. L., et al. 2011, MNRAS, 410, 2428 [NASA ADS] [CrossRef] [Google Scholar]
- Zapartas, E., de Mink, S. E., Justham, S., et al. 2021, A&A, 645, A6 [NASA ADS] [CrossRef] [EDP Sciences] [Google Scholar]
- Zinn, P. C., Grunden, P., & Bomans, D. J. 2011, A&A, 536, A103 [NASA ADS] [CrossRef] [EDP Sciences] [Google Scholar]
The LoTSS data are taken with the full configuration of the LOFAR array, including international stations, but only the Dutch configuration of the array is processed. The data are available for reprocessing to 0.3″ resolution.
It has likely also been observed by eROSITA (Sunyaev et al. 2021), but the observations are not public as of writing this paper.
All Tables
Integrated flux density of the ring centered at α = 14h1 1ml2s.6, δ = +79°23′15″, with inner and outer radii of 14′.2 and 28′.4 at various frequencies.
All Figures
|
Fig. 1 Possible Calvera supernova remnant. (a) Radio emission from the diffuse ring at 144 MHz in the LOFAR HBA LoTSS imaging mosaic (1°25 × 1°25 field of view, 20″ resolution). The location of Calvera is indicated with a circle, with the arrow representing the Halpern & Gotthelf (2015) proper motion from 10kyr in the past to 10kyr into the future. The dashed lines indicate the propagated 1σ positional uncertainty due to proper motion. The cross sign indicates the estimated center of the diffuse ring, with the dotted circles representing the inner and outer radii. The dashed circle (4′ radius) denotes the location of the diffuse X-ray emission seen by Zane et al. (2011) from 1RXS J140818.1+792113, with the square indicating the location of Ha emission. (b) The diffuse ring in the Westerbork Synthesis Radio Telescope WENSS survey imaging at 325 MHz and (c) the Very Large Array NVSS survey at 1.4 GHz. Both panels have a 1°25 × 1°25 field of view and an identical pointing and orientation to panel a. (d) The 0.1-2.4 keV X-ray image from RASS (Voges et al. 1999), with the ring center and inner outer radii of the radio ring denoted by the cross and dotted circles. The dashed circle encircles the emission from 1RXS J140818.1+792113. (e) A 2′ × 2′ section of the 6″ resolution LoTSS imaging mosaic at the location of Calvera, indicated with the dotted circle (10″ radius). |
| In the text | |
|
Fig. 2 Detection of extended Hα emission in the INT/WFC observations in the narrowband Hα filter (panel a), the broadband r-band filter (panel b), and the continuum subtracted Hα-r (panel c). Each panel shows a 4′ × 4′ field of view, with the dashed circle representing the extent of the diffuse X-ray emission from 1RXS 1140818.1+792113 (see Fig. 1). Radio contours from the 6″ LOFAR mosaic are overlaid in panel a. |
| In the text | |
|
Fig. 3 1 GHz surface brightness versus diameter for the Vukotic et al. (2019) sample of Galactic SNRs with known distances (blue) and the Urosevic et al. (2005) sample of extragalactic SNRs. The purported Calvera SNR was plotted in red using the measured surface brightness at 144 MHz and the best-fit spectral index of 0.71, and the 54 pc diameter derived from the 3.3 kpc distance estimate of Mereghetti et al. (2021). |
| In the text | |
Current usage metrics show cumulative count of Article Views (full-text article views including HTML views, PDF and ePub downloads, according to the available data) and Abstracts Views on Vision4Press platform.
Data correspond to usage on the plateform after 2015. The current usage metrics is available 48-96 hours after online publication and is updated daily on week days.
Initial download of the metrics may take a while.