Fig. 3.
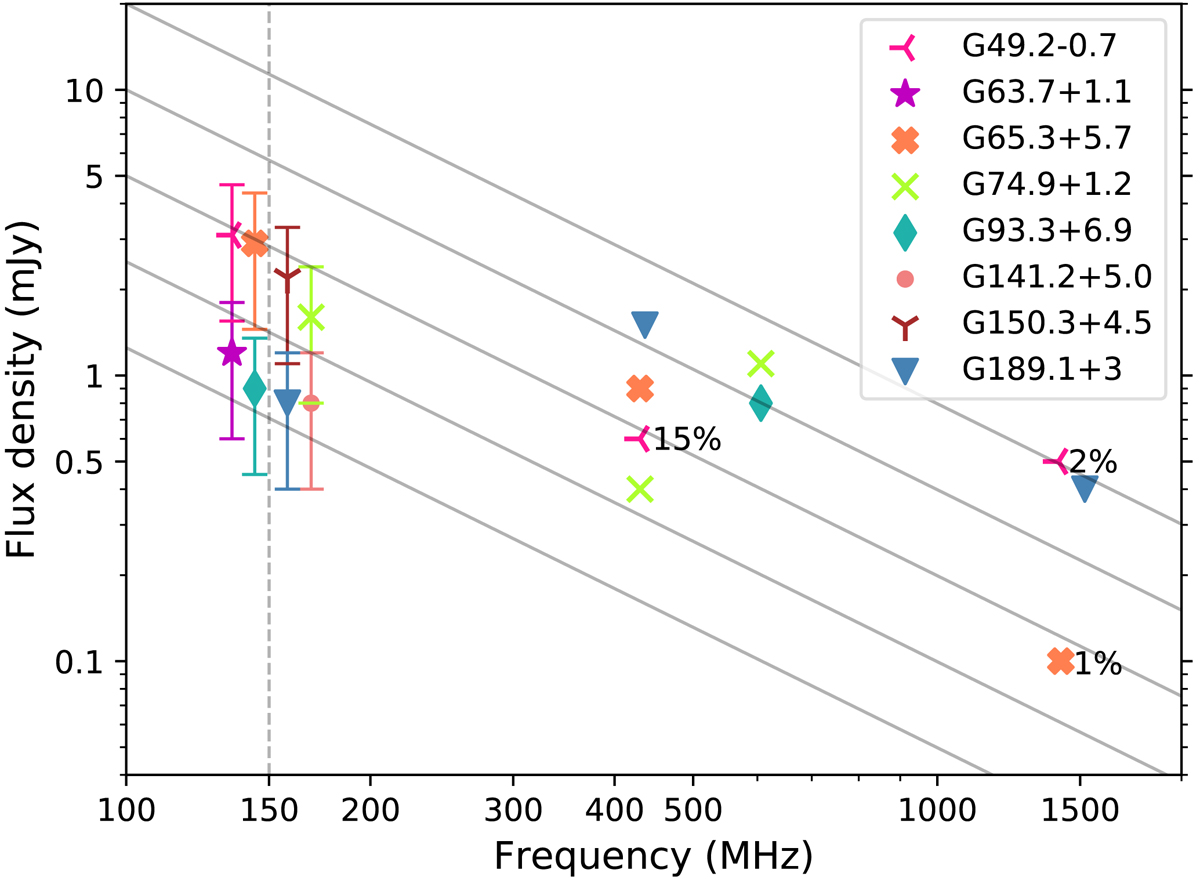
Our sensitivity limits (left, at 150 MHz) compared to applicable earlier work. For previous searches that did not cover the entire supernova remnant size, the searched fraction is indicated. Per frequency only the most sensitive limits obtained are shown. A grid is overlaid with spectral slope α = −1.4 to indicate the scaling of our sensitivity limits (Bates et al. 2013). For visibility our limits are plotted slightly offset from the 150 MHz observing frequency (dashed line).
Current usage metrics show cumulative count of Article Views (full-text article views including HTML views, PDF and ePub downloads, according to the available data) and Abstracts Views on Vision4Press platform.
Data correspond to usage on the plateform after 2015. The current usage metrics is available 48-96 hours after online publication and is updated daily on week days.
Initial download of the metrics may take a while.